
Monthly reading for September 2026
Business Birth Rate Index (BBR Index)
BBR Index, September 2026: 102.0
Up 3.6 points from August's 98.4
The BBR Index measures the pace of company births in India: new companies registered per working day (Monday to Friday count as one day each and Saturday as half), where 100 is the January to August 2026 average.
Next reading: Thursday 5 November 2026 (October data)
24,325
companies registered in September 2026
1,013.5
companies per working day
Base 994.1, over 24.0 working days
10,877
limited liability partnerships (LLPs) registered in September 2026
17.3
new companies per million people
India's business birth rate in September 2026
In September India registered a new company about every 2 minutes, and a new company or LLP every 74 seconds (September's totals spread over every hour of the month).
Key findings, September 2026
Five findings, generated from the data by fixed rules. Quote them with the source line.
Index
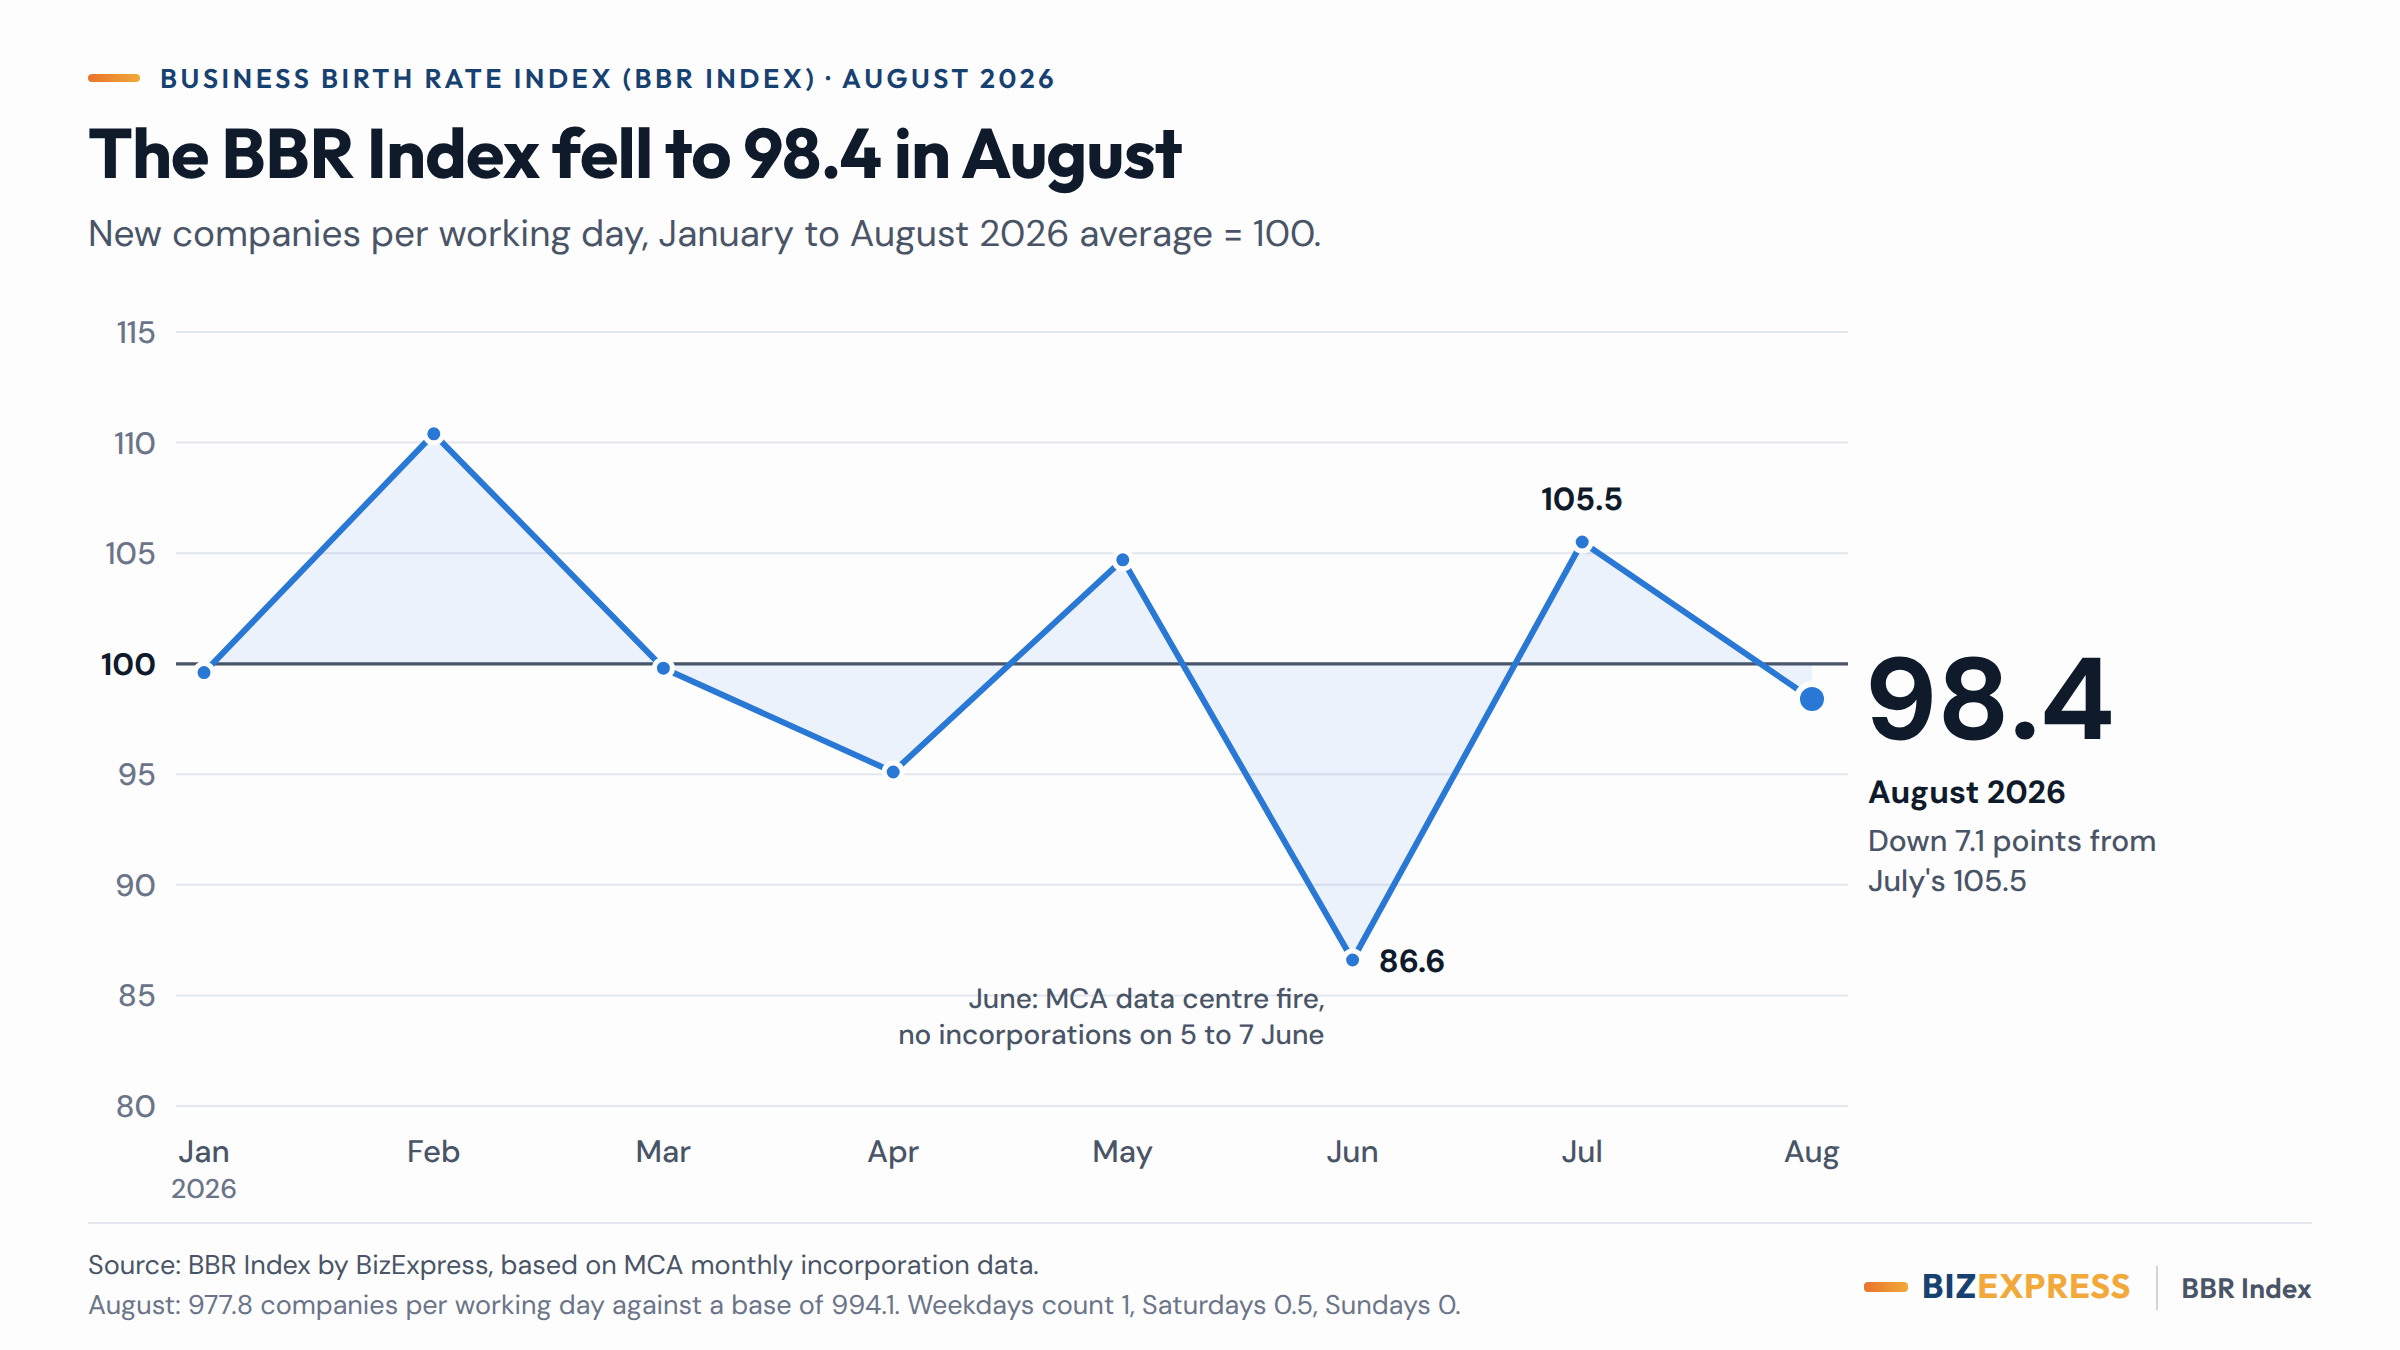
The BBR Index rose 3.6 points to 102.0 in September 2026, from 98.4 in August. India registered 24,325 companies, 1,013.5 per working day against a base of 994.1.
Sub-indices
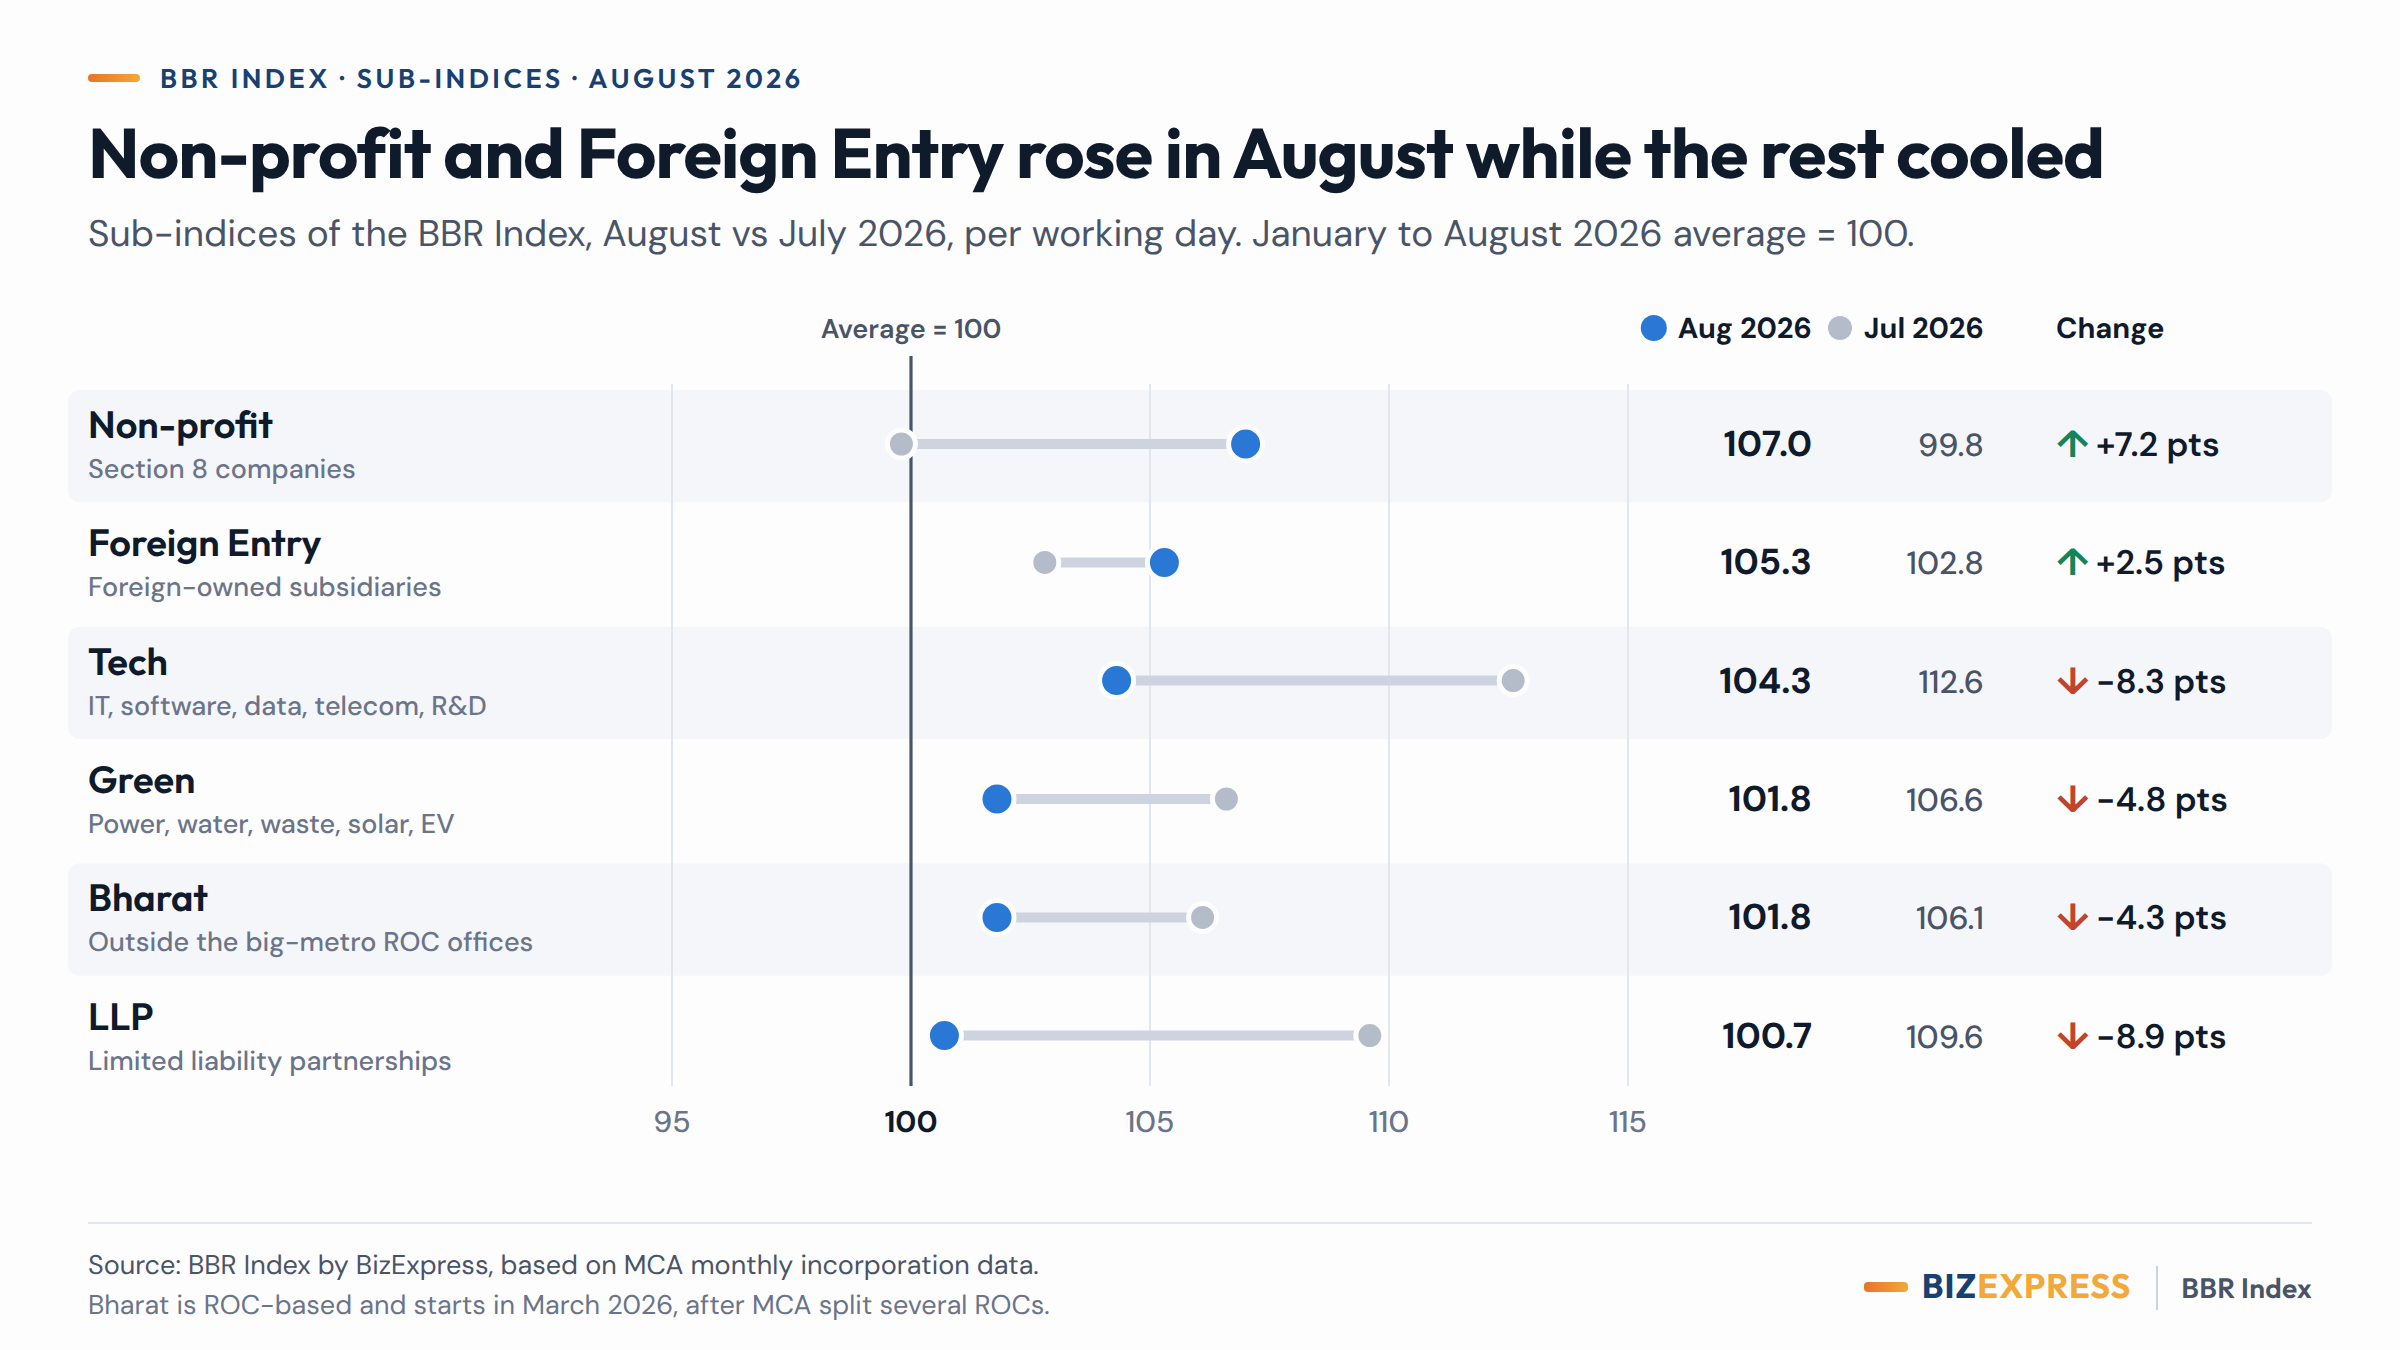
Green was the strongest sub-index at 116.8, up 15.0 points; Non-profit was the weakest at 94.3, down 12.7 points. Five of the six sub-indices rose.
Birth rate
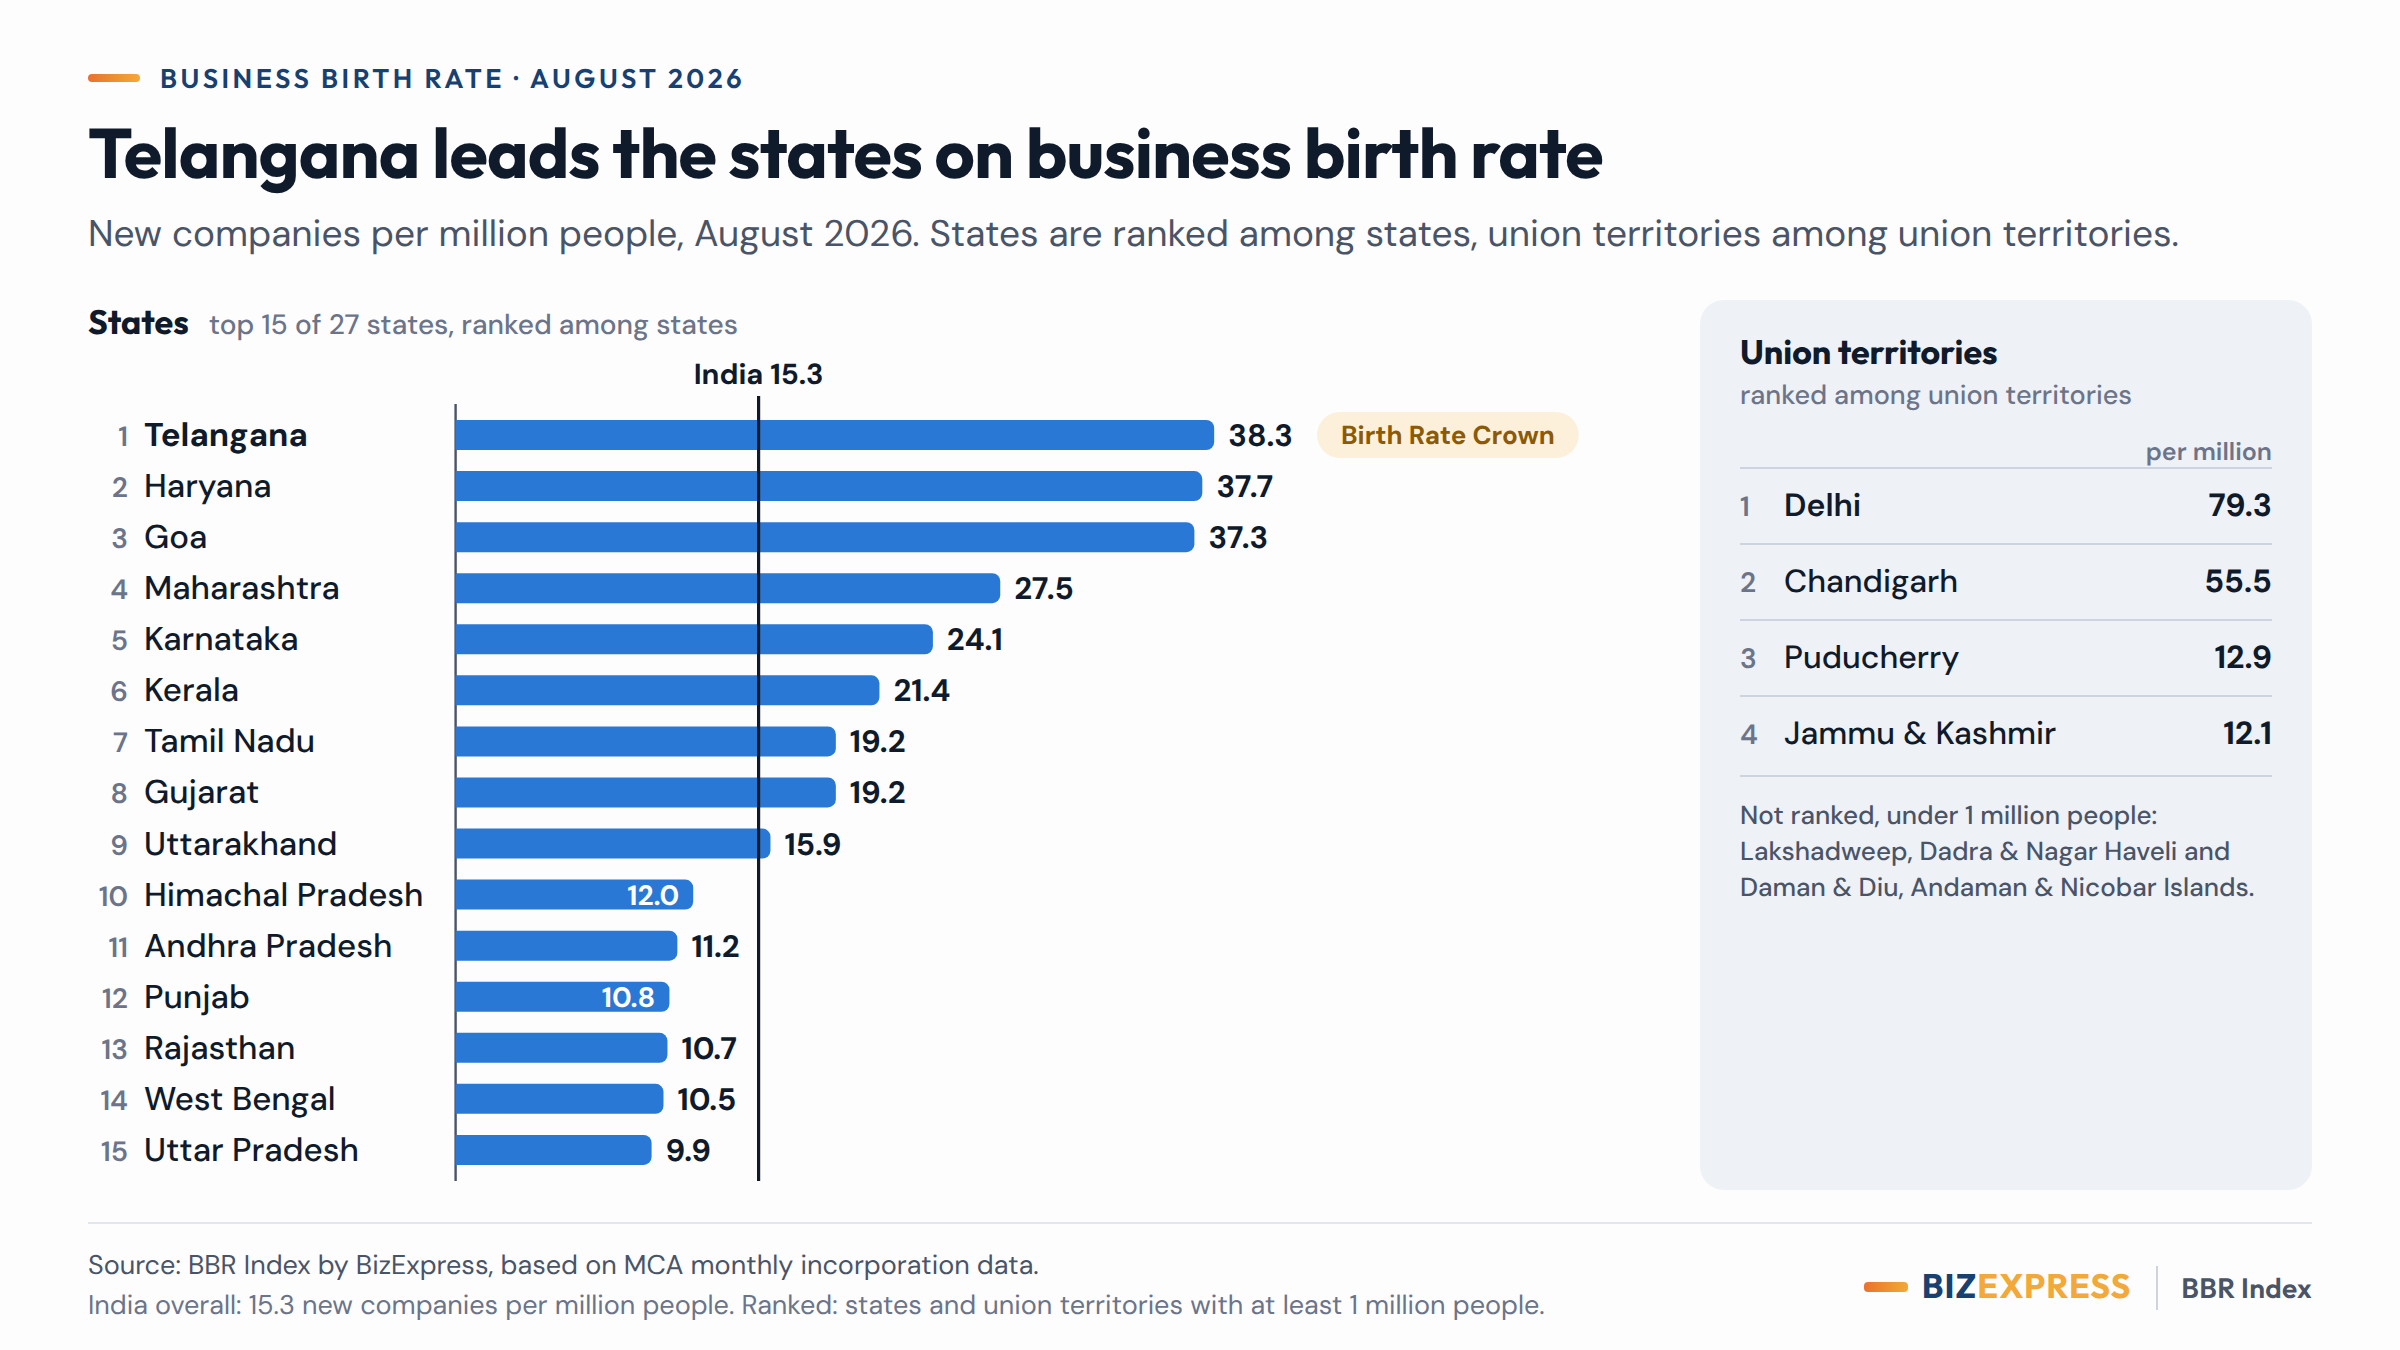
Telangana had the highest business birth rate among states in September 2026, 45.2 new companies per million people, against 17.3 for India as a whole; among union territories Delhi led at 91.9. Telangana takes the Birth Rate Crown for the sixth month running.
Milestone
India passed 2,00,000 companies in 2026 on 25 September 2026. At the July to September pace of 1,133.9 companies and LLPs a day, India would reach 3,00,000 companies and LLPs in 2026 around 6 October 2026: an estimate that the October 2026 file will confirm.
Sector of the Month
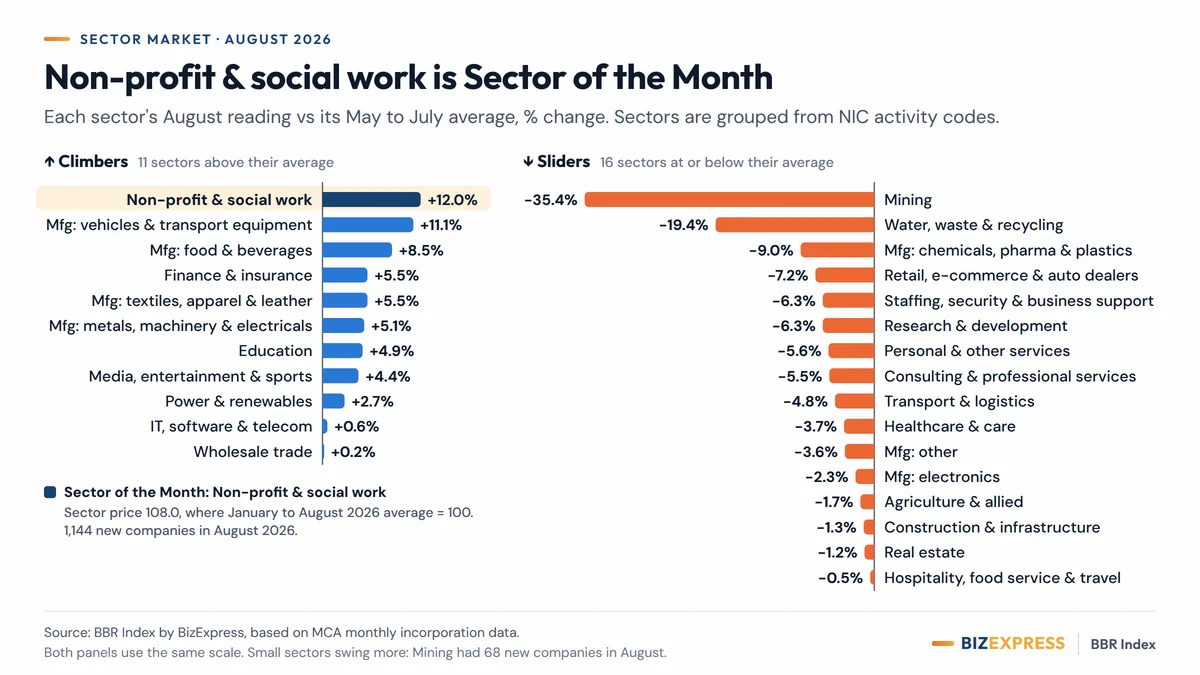
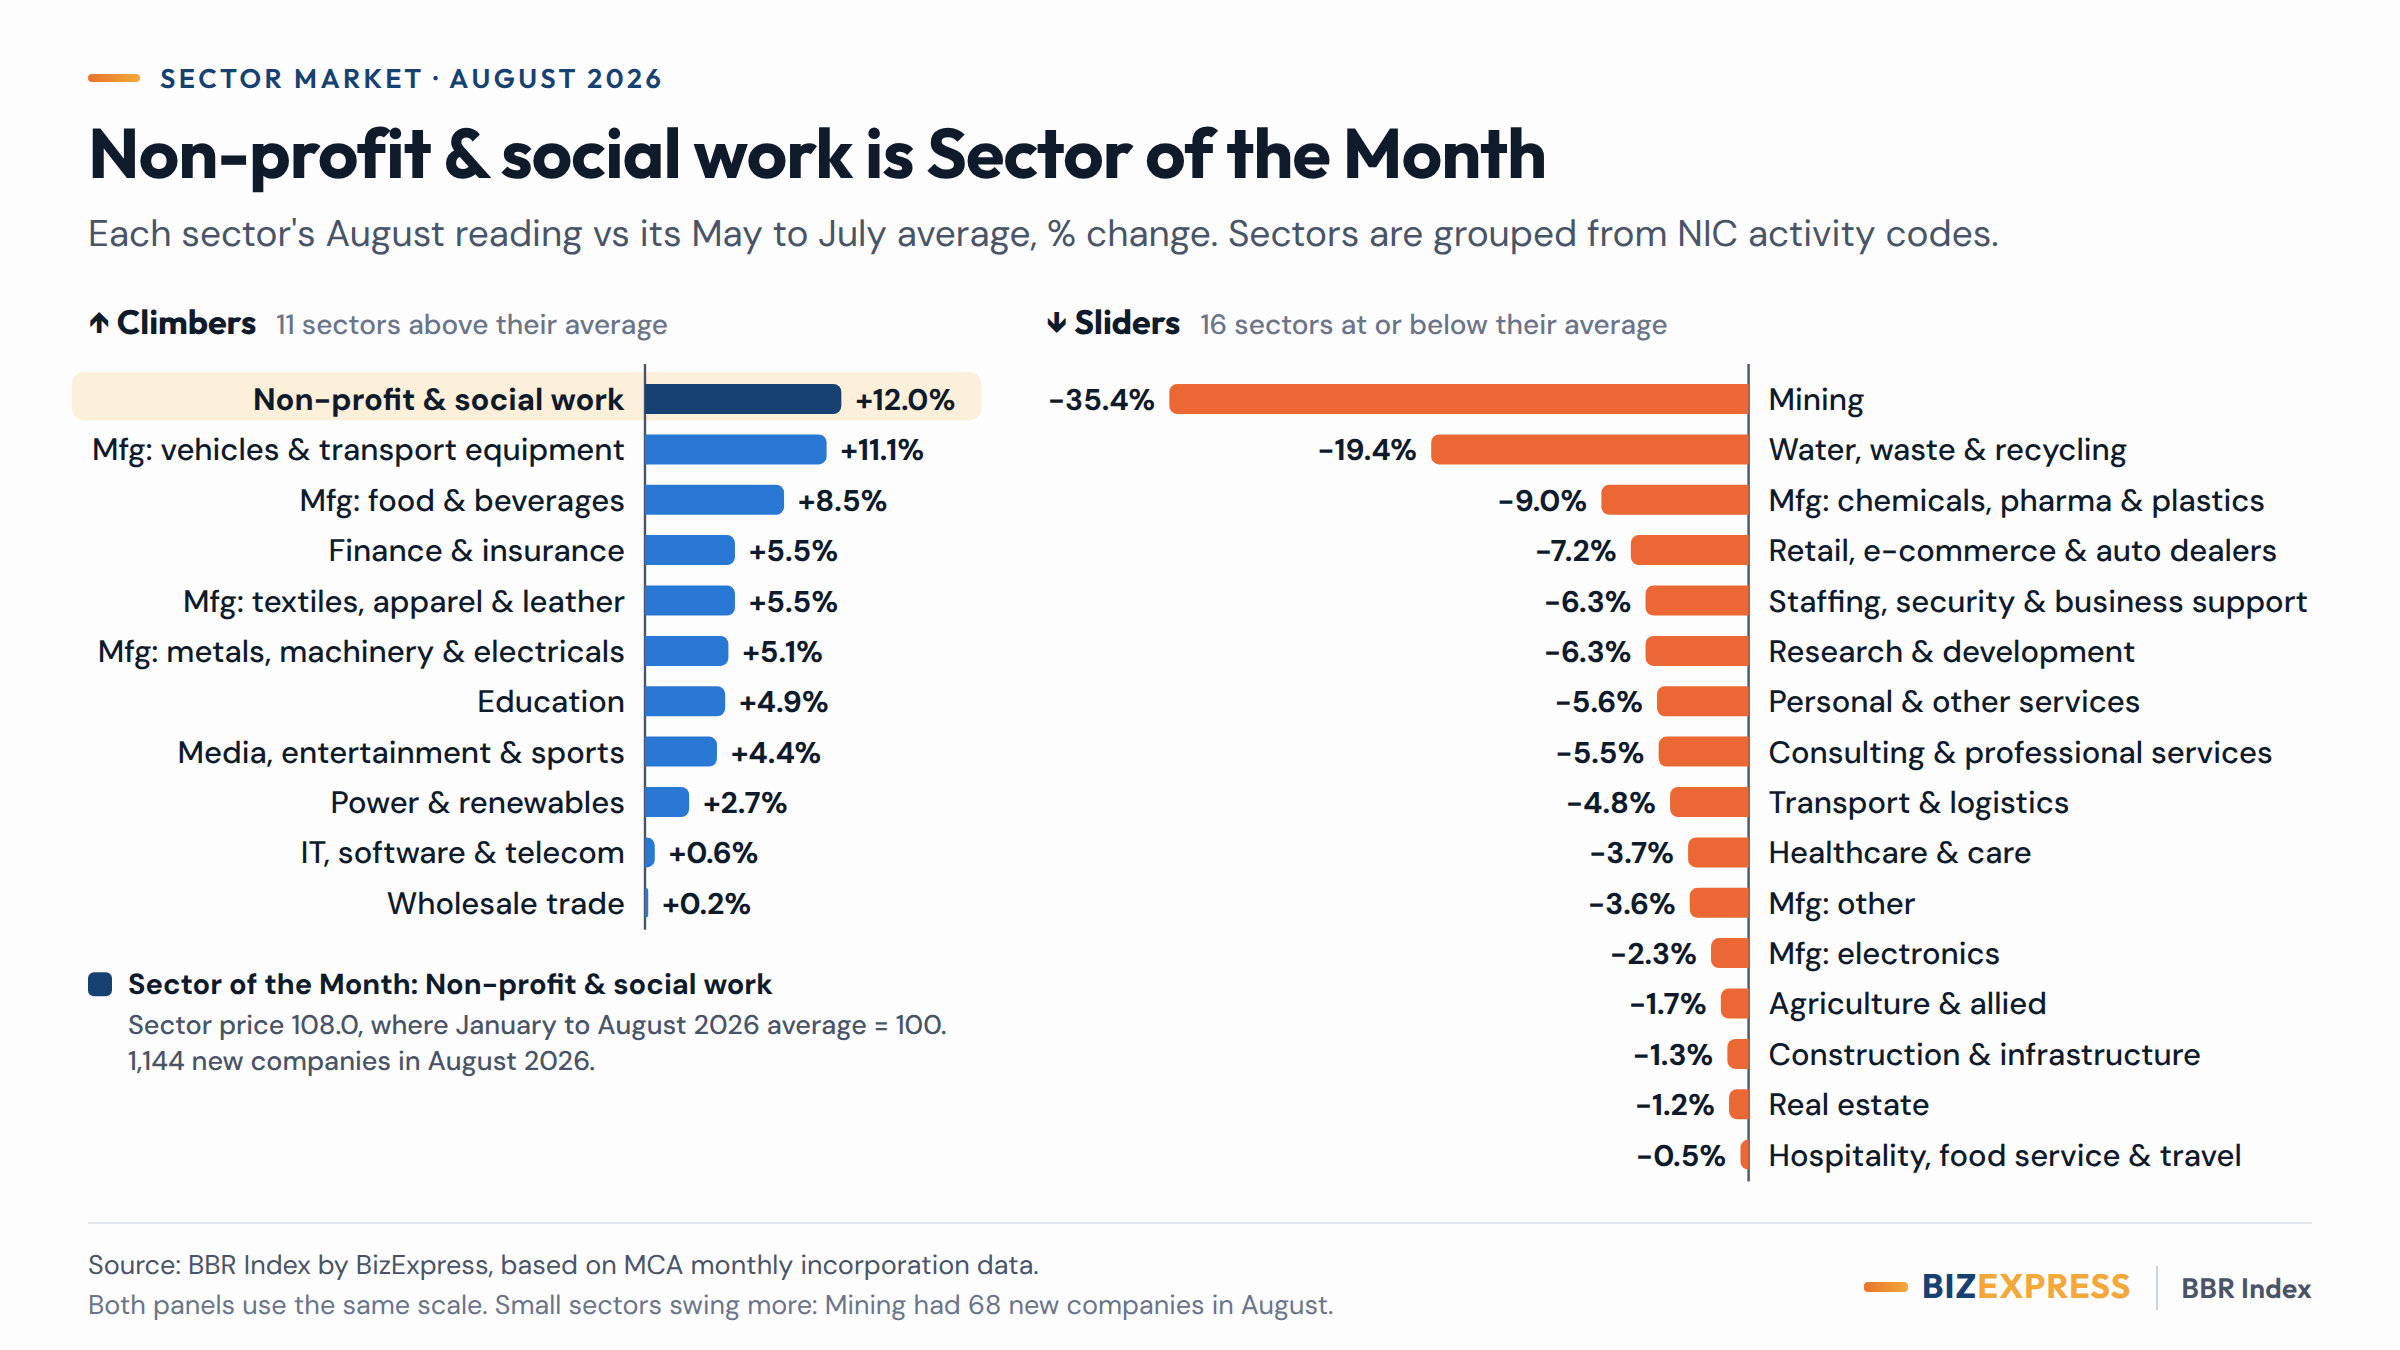
Power & renewables was Sector of the Month: its sector-market index stood at 121.7 (January to August 2026 average = 100), 24.6% above its June to August 2026 average, with 690 new companies in September 2026.
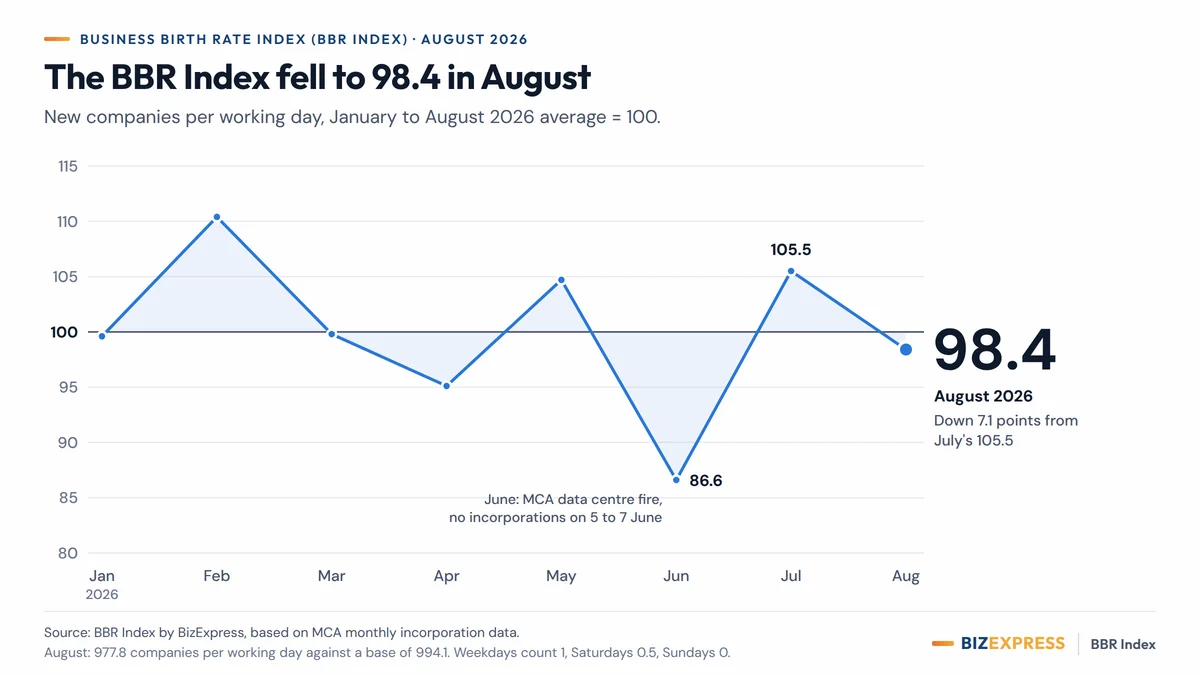
The BBR Index by month, January to September 2026
Companies registered per working day, indexed so that the January to August 2026 average equals 100.
- BBR Index
- Base = 100 (January to August 2026 average)
| Month | Index | Companies | Working days | Companies per working day |
|---|---|---|---|---|
| January 2026 | 99.6 | 23,269 | 23.5 | 990.2 |
| February 2026 | 110.4 | 24,136 | 22.0 | 1,097.1 |
| March 2026 | 99.8 | 22,320 | 22.5 | 992.0 |
| April 2026 | 95.1 | 21,737 | 23.0 | 945.1 |
| May 2026 | 104.7 | 21,859 | 21.0 | 1,040.9 |
| June 2026 | 86.6 | 19,372 | 22.5 | 861.0 |
| July 2026 | 105.5 | 26,225 | 25.0 | 1,049.0 |
| August 2026 | 98.4 | 21,511 | 22.0 | 977.8 |
| September 2026 | 102.0 | 24,325 | 24.0 | 1,013.5 |
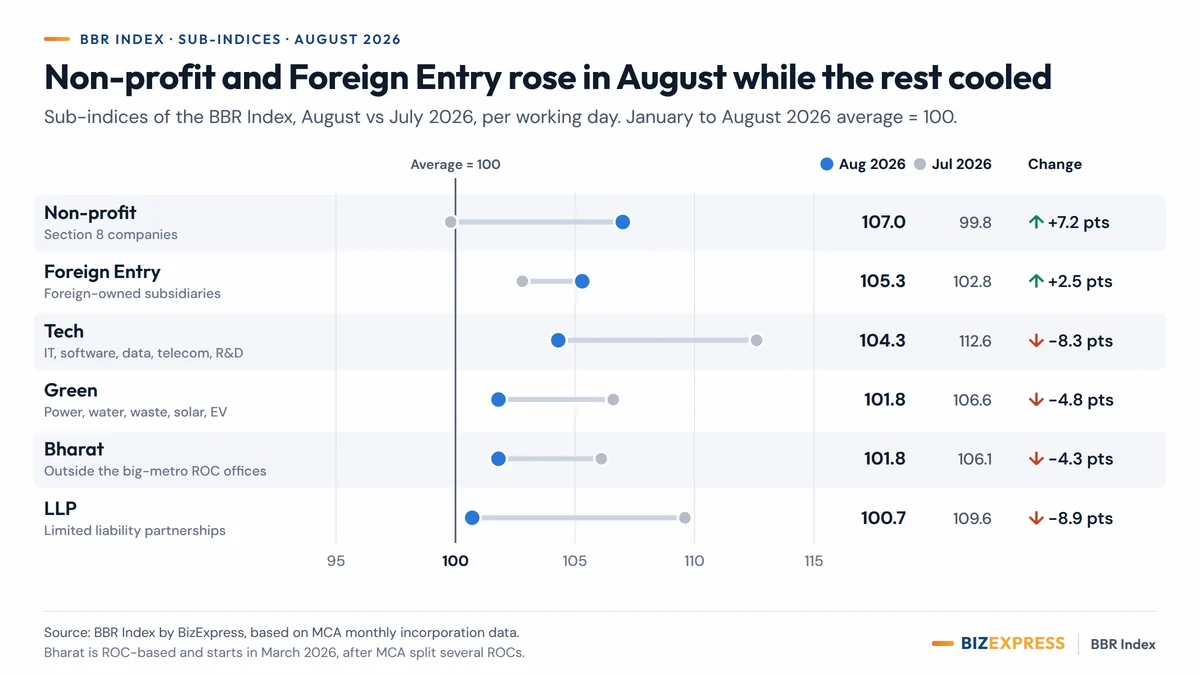
Sub-indices
Six slices of new company formation, each indexed to its own January to August 2026 average per working day. Values for September 2026, change on August.
Tech
up 4.8 points109.1
Tech: August 2026: 104.3
IT, software, data, telecom, electronics and R&D companies
4,326 companies in September 2026
Green
up 15.0 points116.8
Green: August 2026: 101.8
Power, water, waste and recycling companies plus solar, EV, storage and climate names
1,095 companies in September 2026
Bharat
up 2.4 points104.2
Bharat: August 2026: 101.8
Companies registered outside the big-metro offices of the Registrar of Companies (ROC)
From March 2026*
9,378 companies in September 2026
Non-profit
down 12.7 points94.3
Non-profit: August 2026: 107.0
Section 8 companies: not-for-profit companies licensed under Section 8 of the Companies Act, 2013
1,671 companies in September 2026
Foreign Entry
up 2.7 points108.0
Foreign Entry: August 2026: 105.3
Foreign-owned subsidiaries plus foreign companies opening an Indian place of business
216 companies in September 2026
LLP
up 4.3 points105.0
LLP: August 2026: 100.7
Limited liability partnerships
10,877 LLPs in September 2026
| Month | Tech | Green | Bharat | Non-profit | Foreign Entry | LLP |
|---|---|---|---|---|---|---|
| January 2026 | 91.9 | 101.8 | not calculated | 99.5 | 100.1 | 99.4 |
| February 2026 | 102.2 | 111.1 | not calculated | 101.6 | 104.2 | 103.0 |
| March 2026 | 95.5 | 92.9 | 105.0 | 107.6 | 99.8 | 97.7 |
| April 2026 | 93.6 | 89.1 | 94.4 | 93.8 | 107.5 | 105.0 |
| May 2026 | 107.1 | 107.7 | 104.2 | 105.5 | 98.9 | 101.7 |
| June 2026 | 92.7 | 89.1 | 88.4 | 86.0 | 81.1 | 81.9 |
| July 2026 | 112.6 | 106.6 | 106.1 | 99.8 | 102.8 | 109.6 |
| August 2026 | 104.3 | 101.8 | 101.8 | 107.0 | 105.3 | 100.7 |
| September 2026 | 109.1 | 116.8 | 104.2 | 94.3 | 108.0 | 105.0 |
| Month | Tech | Green | Bharat | Non-profit | Foreign Entry | LLP |
|---|---|---|---|---|---|---|
| January 2026 | 3,566 | 935 | 9,417 | 1,727 | 196 | 10,081 |
| February 2026 | 3,713 | 955 | 9,564 | 1,651 | 191 | 9,780 |
| March 2026 | 3,550 | 817 | 8,858 | 1,788 | 187 | 9,489 |
| April 2026 | 3,555 | 801 | 8,146 | 1,593 | 206 | 10,424 |
| May 2026 | 3,714 | 884 | 8,205 | 1,636 | 173 | 9,216 |
| June 2026 | 3,446 | 783 | 7,457 | 1,429 | 152 | 7,951 |
| July 2026 | 4,650 | 1,041 | 9,947 | 1,843 | 214 | 11,819 |
| August 2026 | 3,790 | 875 | 8,403 | 1,738 | 193 | 9,562 |
| September 2026 | 4,326 | 1,095 | 9,378 | 1,671 | 216 | 10,877 |
Bharat is calculated from March 2026, so its base is the March to August 2026 average. MCA split the Delhi, Mumbai, Kanpur and Kolkata ROCs on 16 February 2026. State totals are unaffected; ROC-office detail and the Bharat sub-index start in March 2026. Source: BBR Index by BizExpress, based on MCA monthly incorporation data.
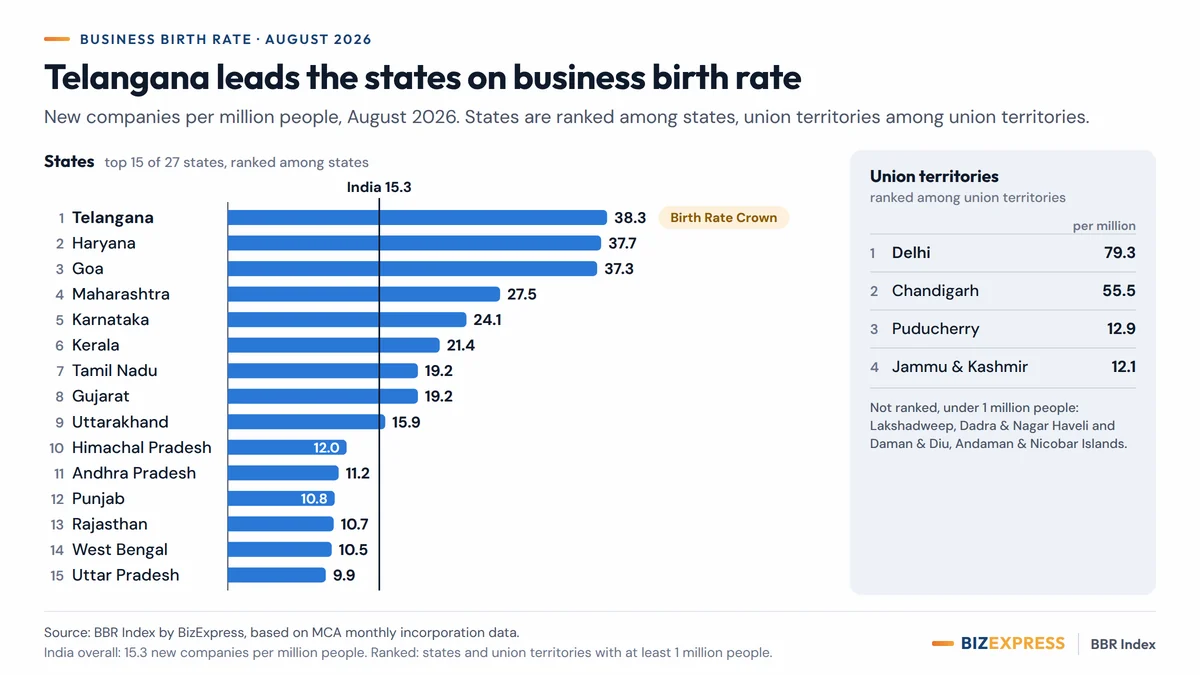
Business birth rate
New companies per million people. States are ranked among states and union territories among union territories. India averaged 17.3 in September 2026.
- Top three in each group
- Others
- India
New companies per million people
States Ranked among 27 states
Union territories Ranked among four union territories with at least 1 million people
Not ranked (fewer than 1 million people): Andaman & Nicobar Islands 9.9; Dadra & Nagar Haveli and Daman & Diu 16.7; Lakshadweep 0.0.
| Rank, Sep 2026 | State | Per million, Sep 2026 | Companies, Sep 2026 | Per million, January to September 2026 | Rank, January to September 2026 | Population |
|---|---|---|---|---|---|---|
| 1 | Telangana | 45.2 | 1,731 | 382.0 | 1 | 3,82,72,000 |
| 2 | Haryana | 42.4 | 1,297 | 355.1 | 3 | 3,05,73,000 |
| 3 | Goa | 40.4 | 64 | 358.2 | 2 | 15,83,000 |
| 4 | Maharashtra | 30.7 | 3,921 | 263.7 | 4 | 12,75,28,000 |
| 5 | Karnataka | 29.2 | 1,988 | 225.0 | 5 | 6,81,15,000 |
| 6 | Kerala | 24.0 | 862 | 198.7 | 6 | 3,59,20,000 |
| 7 | Tamil Nadu | 23.5 | 1,808 | 186.2 | 7 | 7,70,89,000 |
| 8 | Uttarakhand | 20.8 | 245 | 159.7 | 9 | 1,17,55,000 |
| 9 | Gujarat | 19.5 | 1,414 | 176.4 | 8 | 7,23,67,000 |
| 10 | Andhra Pradesh | 12.8 | 684 | 102.1 | 12 | 5,33,40,000 |
| 11 | Rajasthan | 12.2 | 997 | 100.8 | 13 | 8,18,97,000 |
| 12 | Himachal Pradesh | 12.0 | 90 | 105.7 | 10 | 75,05,000 |
| 13 | Arunachal Pradesh | 11.4 | 18 | 83.8 | 16 | 15,76,000 |
| 14 | Uttar Pradesh | 11.1 | 2,676 | 95.6 | 14 | 24,10,66,874 |
| 15 | Punjab | 11.0 | 339 | 102.2 | 11 | 3,09,26,000 |
| 16 | West Bengal | 10.6 | 1,057 | 91.5 | 15 | 9,95,63,000 |
| 17 | Odisha | 10.1 | 468 | 79.7 | 17 | 4,65,66,000 |
| 18 | Madhya Pradesh | 8.6 | 756 | 72.4 | 18 | 8,76,10,000 |
| 19 | Jharkhand | 7.4 | 294 | 65.1 | 20 | 3,99,63,000 |
| 20 | Chhattisgarh | 7.3 | 224 | 59.1 | 21 | 3,05,24,000 |
| 21 | Bihar | 6.4 | 818 | 56.5 | 22 | 12,85,92,000 |
| 22 | Nagaland | 6.2 | 14 | 33.7 | 26 | 22,53,000 |
| 23 | Assam | 5.7 | 207 | 51.0 | 23 | 3,60,47,000 |
| 24 | Manipur | 5.2 | 17 | 65.8 | 19 | 32,53,000 |
| 25 | Tripura | 4.3 | 18 | 43.5 | 24 | 41,84,000 |
| 26 | Mizoram | 4.0 | 5 | 34.4 | 25 | 12,50,000 |
| 27 | Meghalaya | 1.5 | 5 | 20.4 | 27 | 33,79,000 |
| India (all states and union territories) | 17.3 | 24,325 | 146.0 | 1,40,22,16,624 |
| Rank, Sep 2026 | Union territory | Per million, Sep 2026 | Companies, Sep 2026 | Per million, January to September 2026 | Rank, January to September 2026 | Population |
|---|---|---|---|---|---|---|
| 1 | Delhi | 91.9 | 2,000 | 783.1 | 1 | 2,17,52,000 |
| 2 | Chandigarh | 54.7 | 68 | 434.4 | 2 | 12,43,000 |
| 3 | Puducherry | 23.0 | 32 | 164.6 | 3 | 13,91,163 |
| 4 | Jammu & Kashmir | 13.8 | 193 | 114.3 | 4 | 1,40,03,000 |
| Not ranked | Andaman & Nicobar Islands | 9.9 | 4 | 141.1 | Not ranked | 4,04,000 |
| Not ranked | Dadra & Nagar Haveli and Daman & Diu | 16.7 | 11 | 104.9 | Not ranked | 6,57,587 |
| Not ranked | Lakshadweep | 0.0 | 0 | 72.5 | Not ranked | 69,000 |
State explorer
Every state and union territory with its September 2026 numbers, ranked within its own group: states among states, union territories among union territories. Choose one for its dossier: new companies, business birth rate, top sector and its place in The Founders' League or the union territory table.
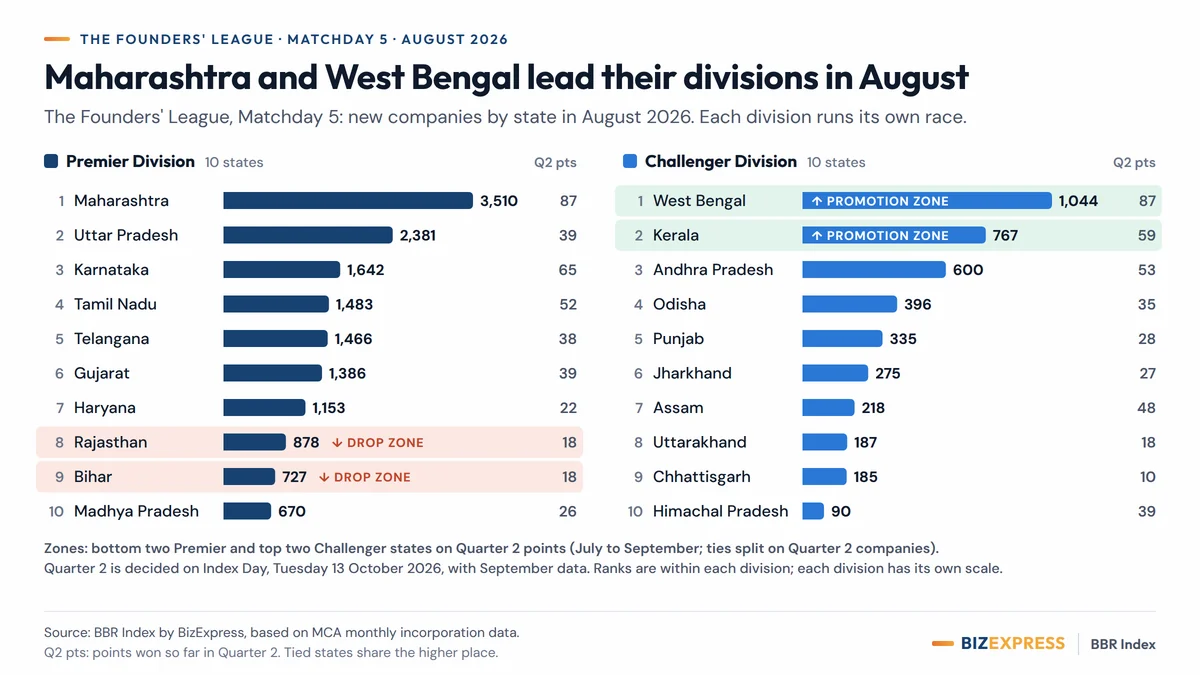
The Founders' League: September crowns and zones
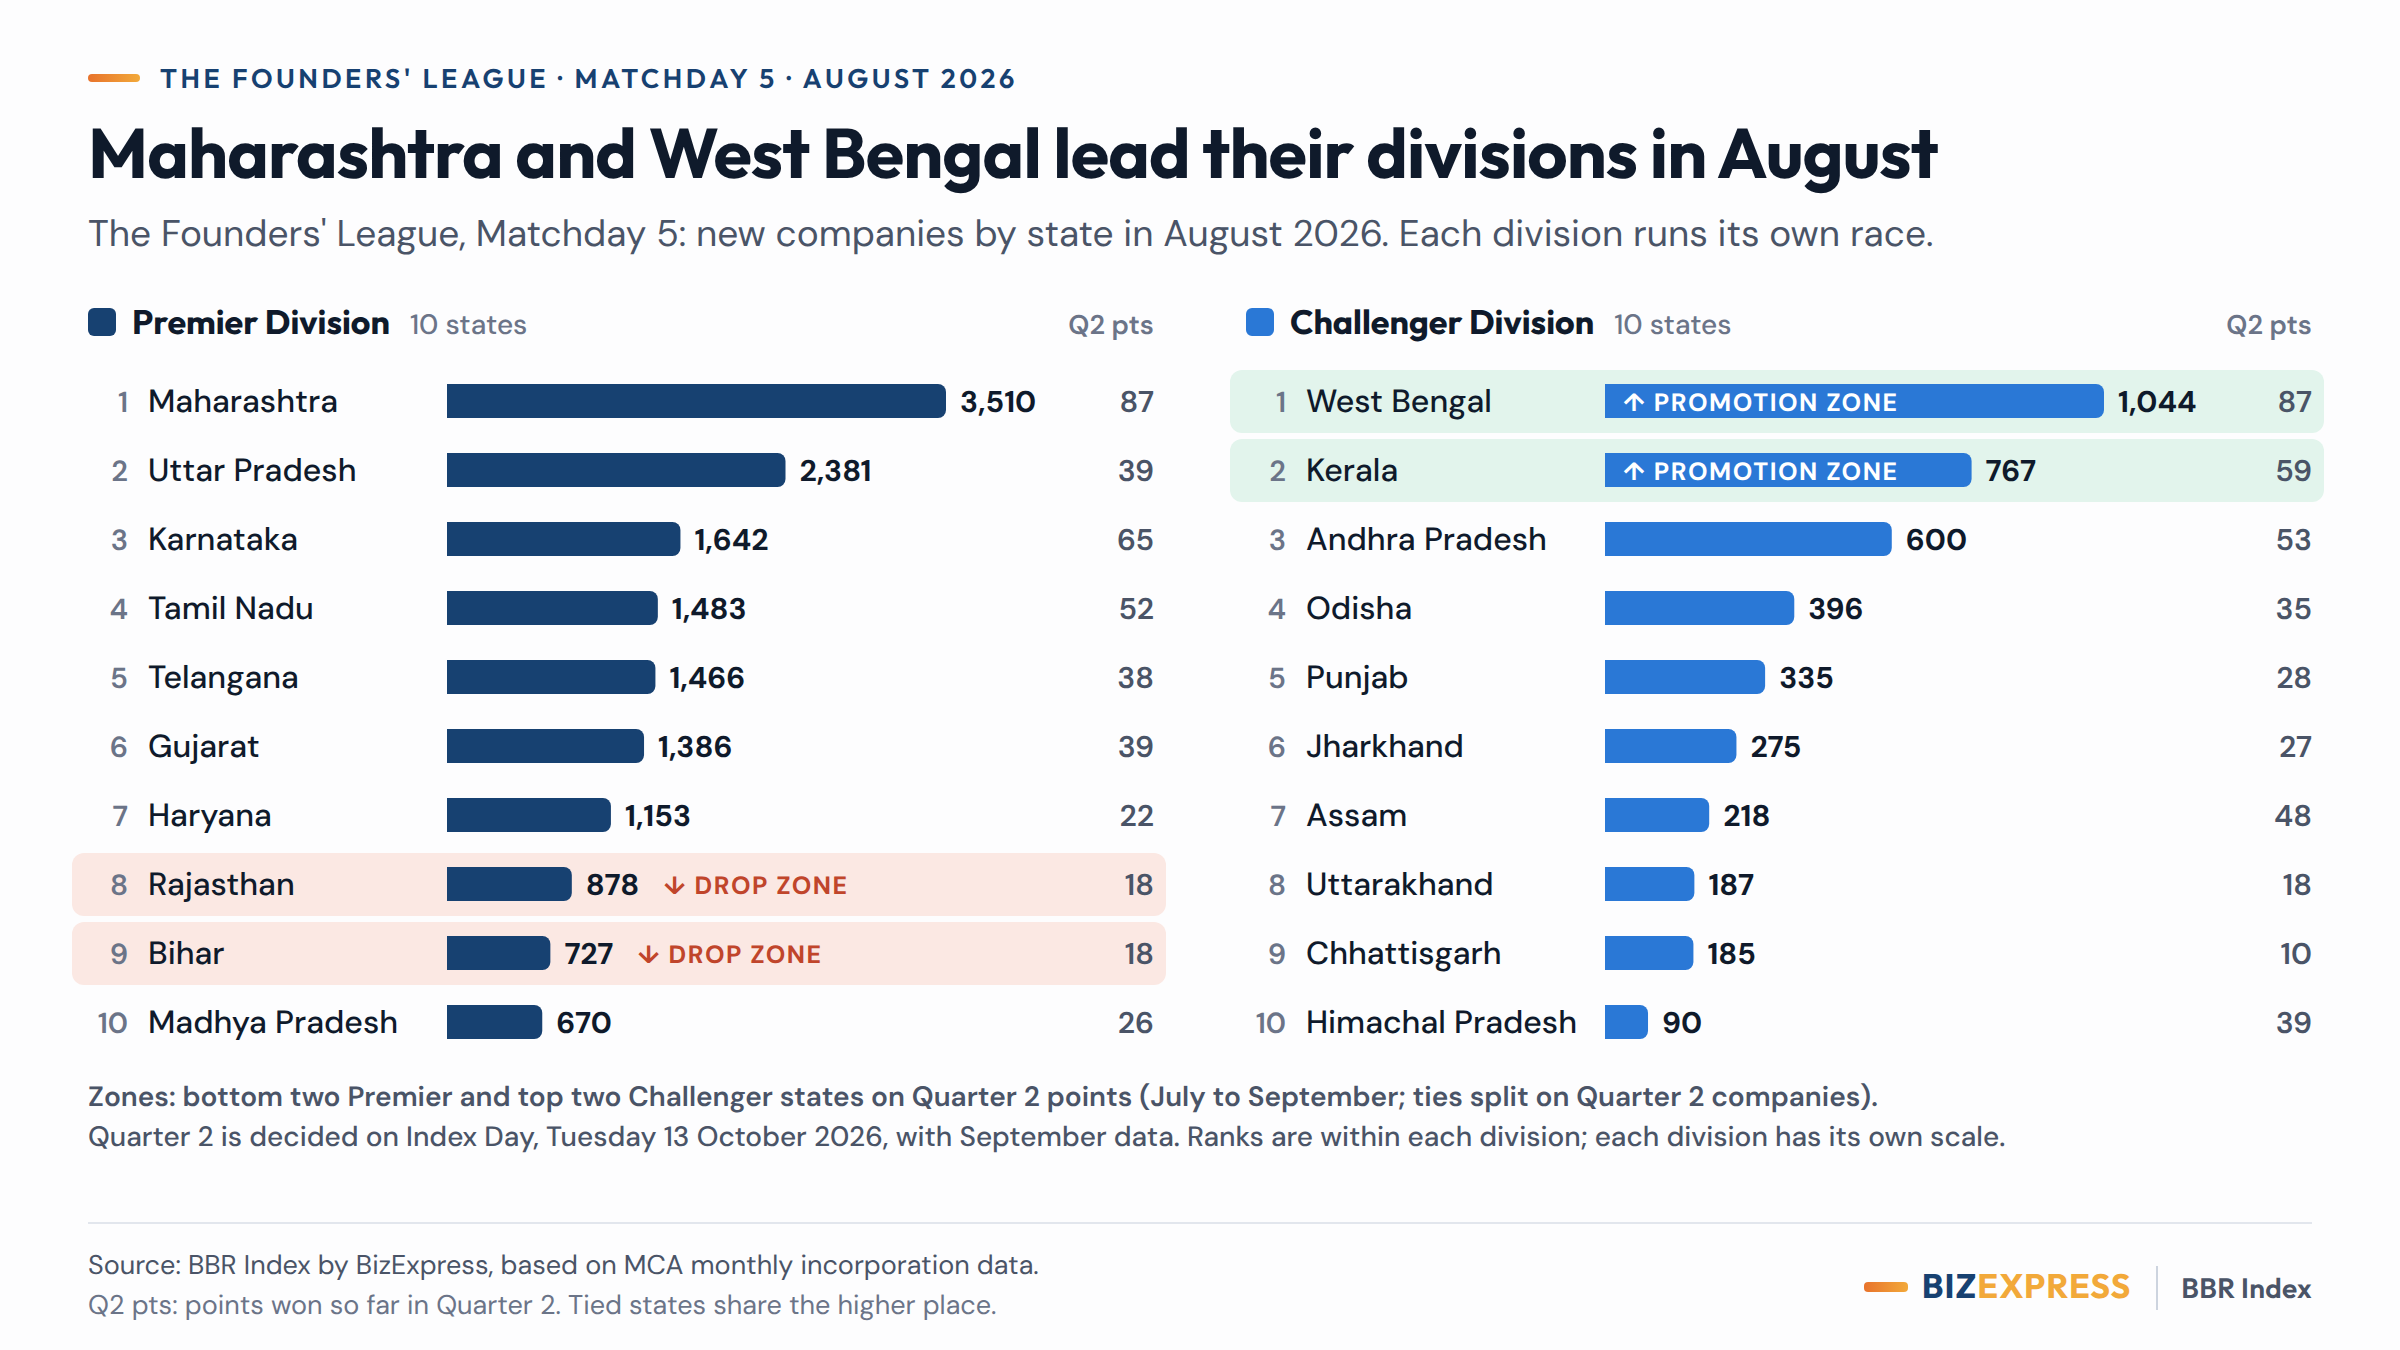
States compete with states in two divisions of ten; union territories have their own table. After Matchday 6, Maharashtra leads the Premier Division on 208 points and Andhra Pradesh leads the Challenger Division on 152.
Volume Crown
Maharashtra
3,921 new companies, 6th month running
Most new companies among states
Birth Rate Crown
Telangana
45.2 new companies per million people, 6th month running
Most new companies per million people, states with at least 1 million people
Momentum Crown
Tamil Nadu
Share of India's new companies 7.0% above its recent average
Biggest gain in share of India's new companies against its recent average, Premier Division
Tech Crown
Karnataka
30.2% of its new companies were in tech (601 of 1,988), 4th month running
Highest share of new companies in tech, states with at least 500 new companies
Green Crown
Rajasthan
9.0% of its new companies were in the green economy (90 of 997), 6th month running
Highest share of new companies in the green economy, states with at least 500 new companies
Rising State Crown
Uttarakhand
Share of India's new companies 14.5% above its recent average
Biggest gain in share of India's new companies against its recent average, Challenger Division
Comeback of the Month
Uttarakhand
Climbed from 18th to 17th
Biggest climb in the national ranking of the 20 league states
Zones
Relegated, Premier Division: Bihar and Madhya Pradesh
Promoted, Challenger Division: West Bengal and Kerala
Decided on Quarter 2 points
Quarter 2 is complete: Bihar and Madhya Pradesh go down to the Challenger Division and West Bengal and Kerala come up to the Premier Division. Points count only inside each division, so a Premier and a Challenger state's points are never compared.
Born in India
Born in India turns the same MCA data into a card for your company's date of incorporation: how many companies India registered that day, how many were born in your state or union territory that month, and a first-year compliance calendar.
Busiest day of 2026 so far
Tuesday 28 July 2026
1,896 companies were incorporated in India that day.
Source: BBR Index by BizExpress, based on MCA monthly incorporation data.
Press room
Charts, data and the full methodology for the September 2026 reading. Free to republish with credit to the BBR Index by BizExpress.
Methodology
- Download BBR Index methodology (full document) (PDF)
BBR Index methodology (full document)
Data
CSV files for January to September 2026 from the monthly build, with Western digit grouping, and a read-me with the field notes, attribution and disclaimer.
- Download BBR Index and sub-indices by month (CSV)
BBR Index and sub-indices by month
- Download States and union territories (ranks within each group) (CSV)
States and union territories (ranks within each group)
- Download Union territory table (CSV)
Union territory table
- Download Sector market (CSV)
Sector market
- Download The Founders' League season table (CSV)
The Founders' League season table
- Download Matchday 6 results, September 2026 (CSV)
Matchday 6 results, September 2026
- Download Crowns by month (CSV)
Crowns by month
- Download Derby results (CSV)
Derby results
- Download Read me: files, fields, attribution and disclaimer (TXT)
Read me: files, fields, attribution and disclaimer
Charts
PNG images, 2,400 pixels wide, with the source line built in. Select a chart to see it larger.
BBR Index by month
Sub-indices, September 2026
Business birth rate, September 2026
The Founders' League, Matchday 6
Sector market, September 2026
Embed kit
Four widgets for newsrooms, state startup missions, newsletters and blogs. Each one updates itself on Index Day and carries the source line.
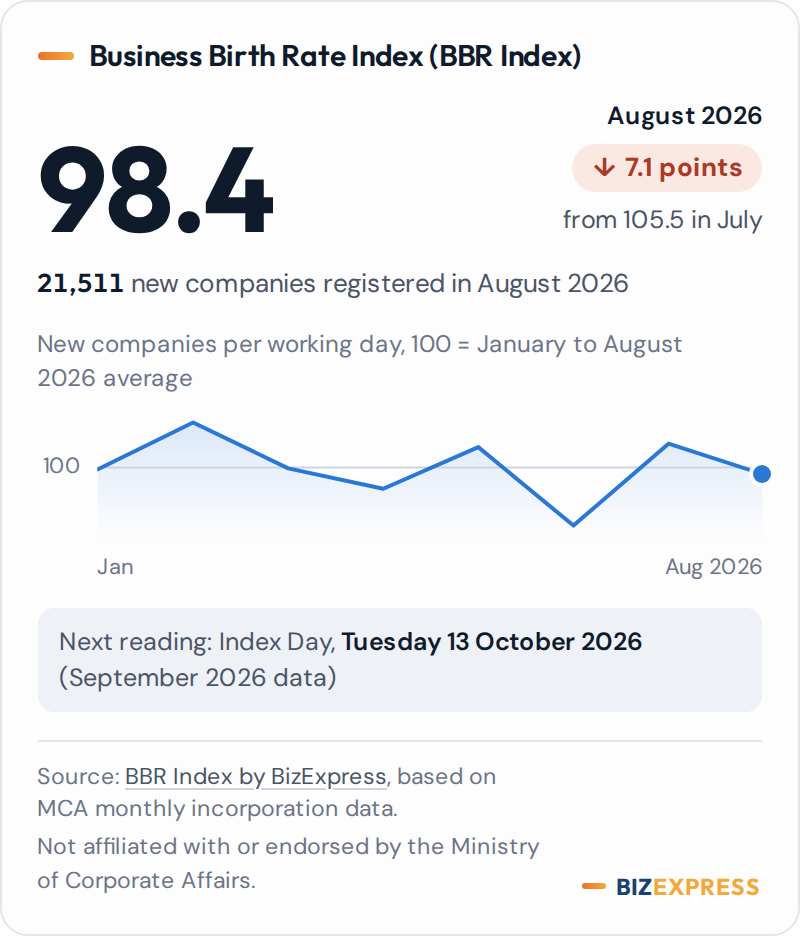
Index card
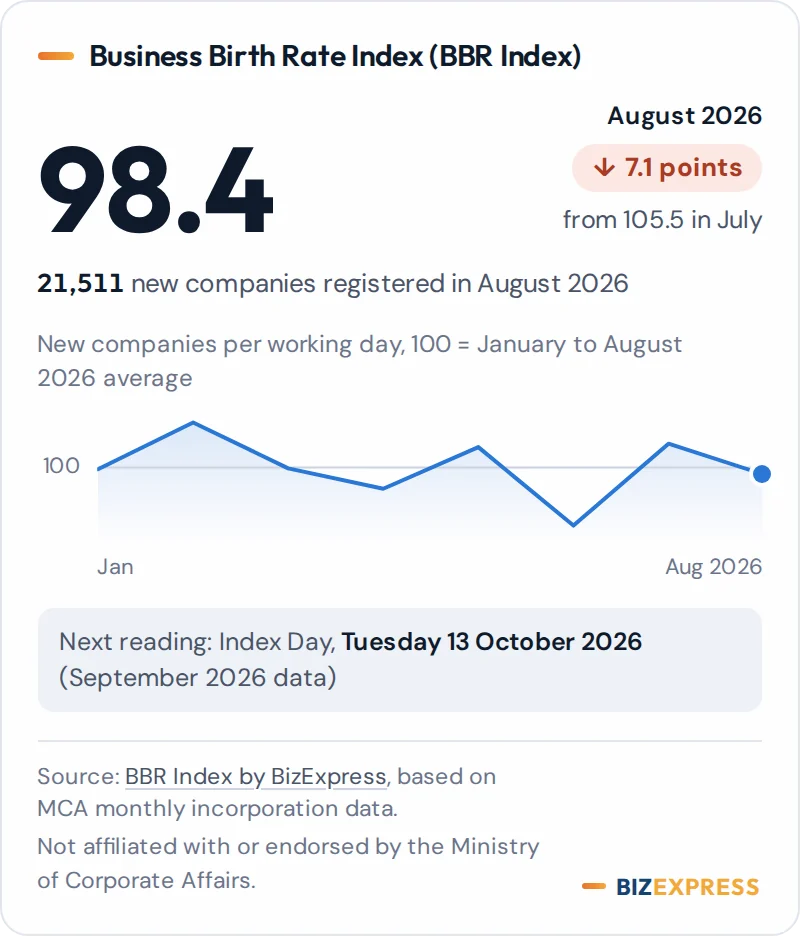
The latest BBR Index reading, its change on the month, a monthly trend line against 100 and the next Index Day.
<iframe src="https://bizexpress.in/business-birth-rate/embed/index-card.html" title="Business Birth Rate Index (BBR Index): Index card" width="400" height="500" loading="lazy" style="border:0;max-width:100%"></iframe>400 × 500 pixels
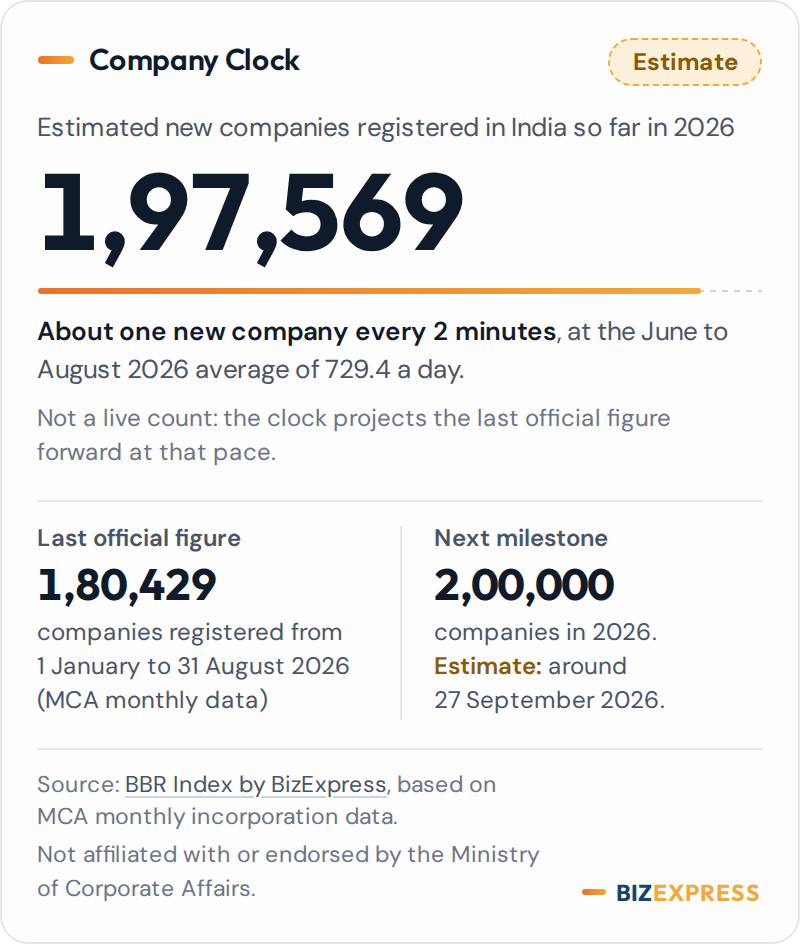
Company Clock
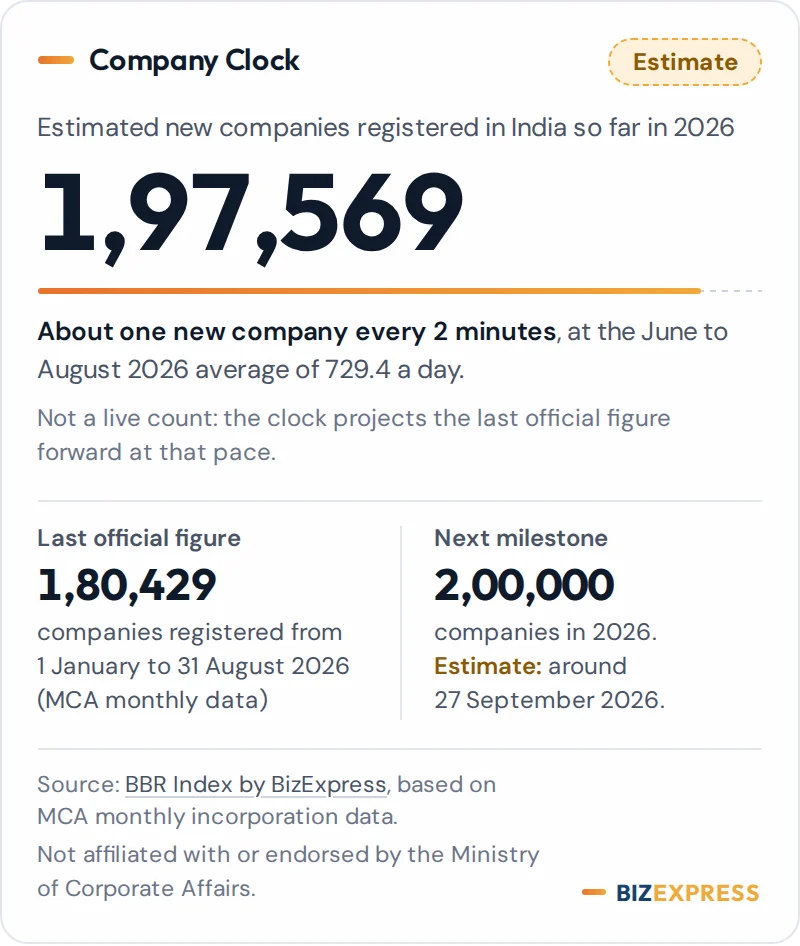
An estimate of companies registered in India so far this calendar year, projected from the last official figure at the recent daily pace. It is not a live count.
<iframe src="https://bizexpress.in/business-birth-rate/embed/company-clock.html" title="Business Birth Rate Index (BBR Index): Company Clock" width="400" height="530" loading="lazy" style="border:0;max-width:100%"></iframe>400 × 530 pixels
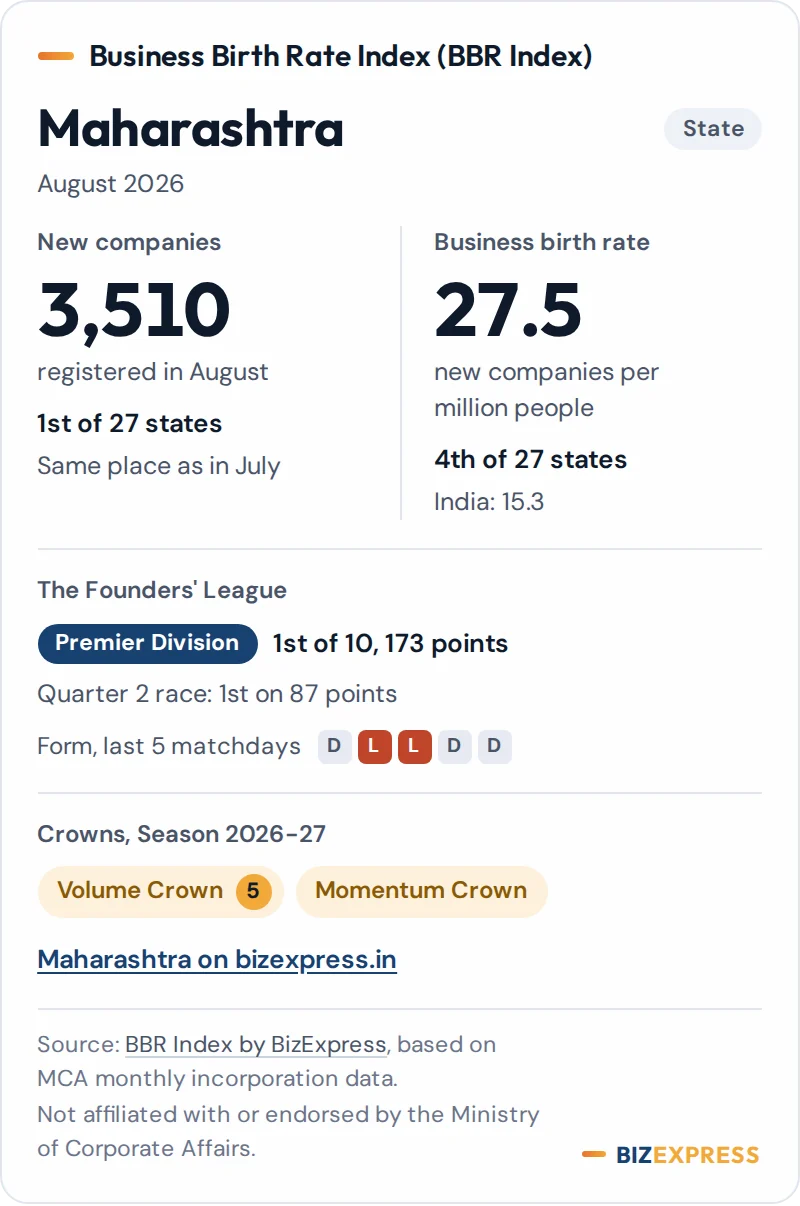
State badge
One state or union territory: new companies and business birth rate, each ranked within its own group, with its division in The Founders' League and its crowns this season.
<iframe src="https://bizexpress.in/business-birth-rate/embed/state-badge.html?state=maharashtra" title="Business Birth Rate Index (BBR Index): State badge" width="400" height="630" loading="lazy" style="border:0;max-width:100%"></iframe>400 × 630 pixels
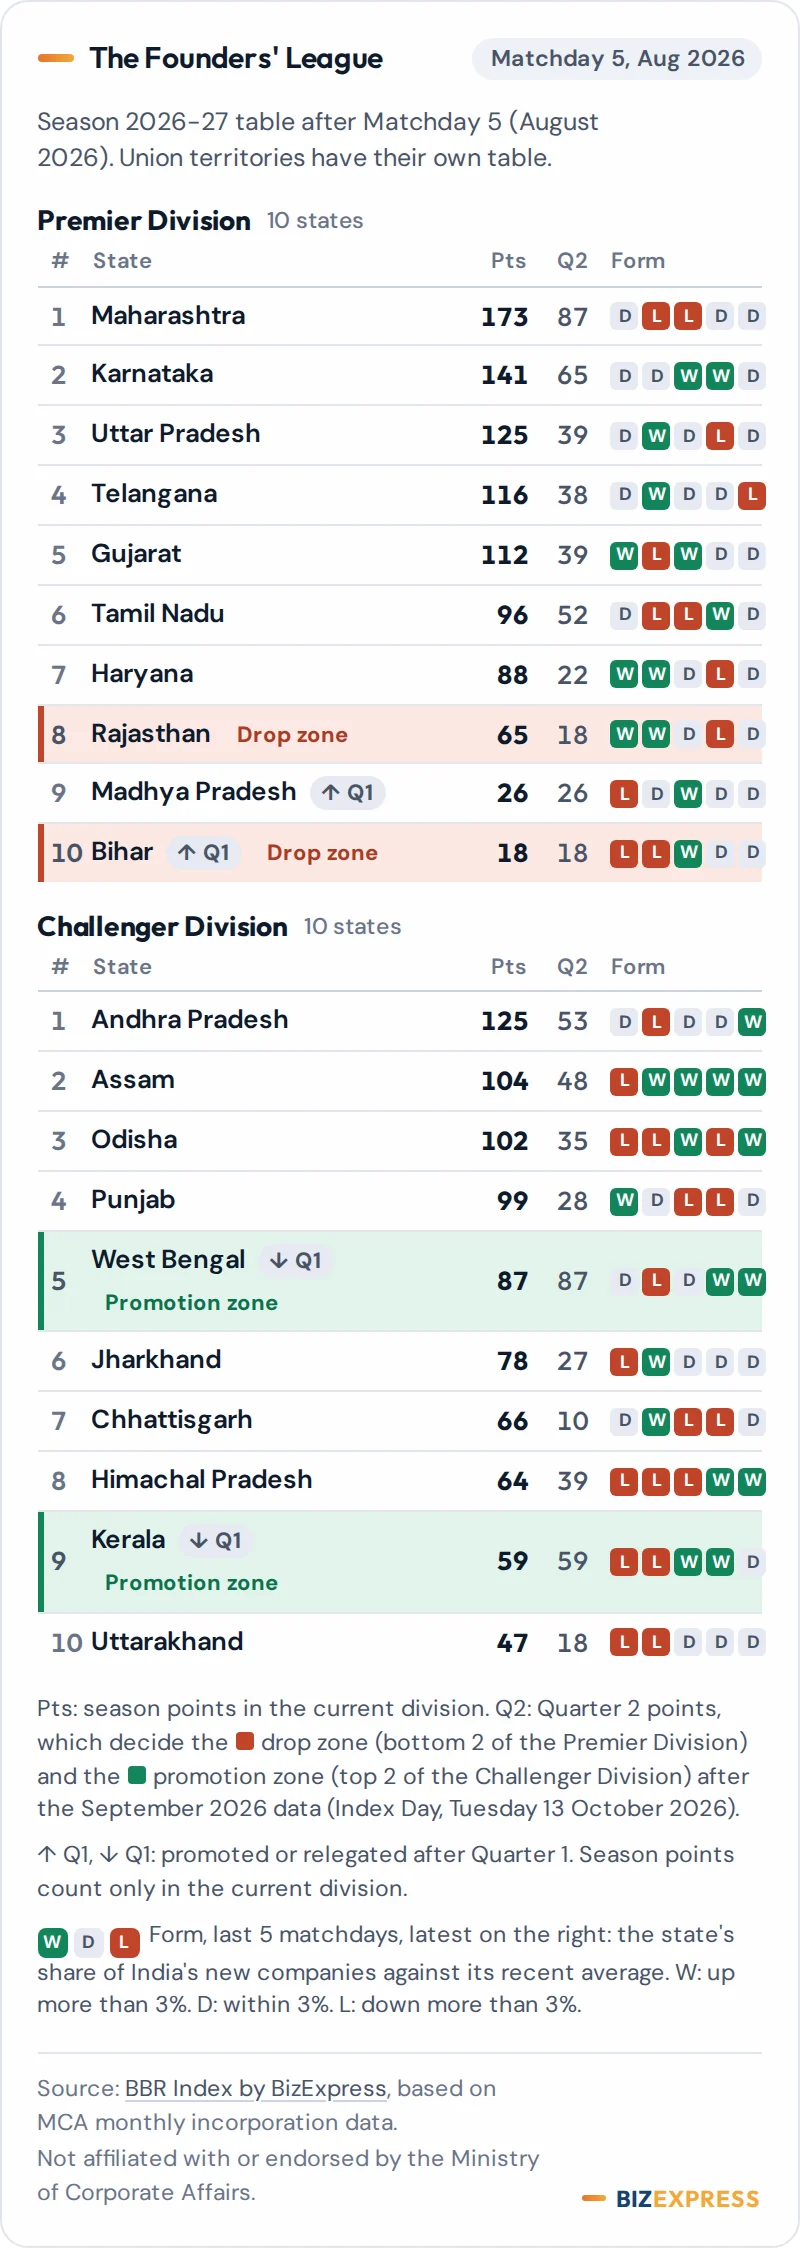
League table
The Founders' League after the latest matchday: both divisions with points, zones and form, or one division on its own.
<iframe src="https://bizexpress.in/business-birth-rate/embed/league-table.html" title="Business Birth Rate Index (BBR Index): League table" width="400" height="1290" loading="lazy" style="border:0;max-width:100%"></iframe>400 × 1290 pixels
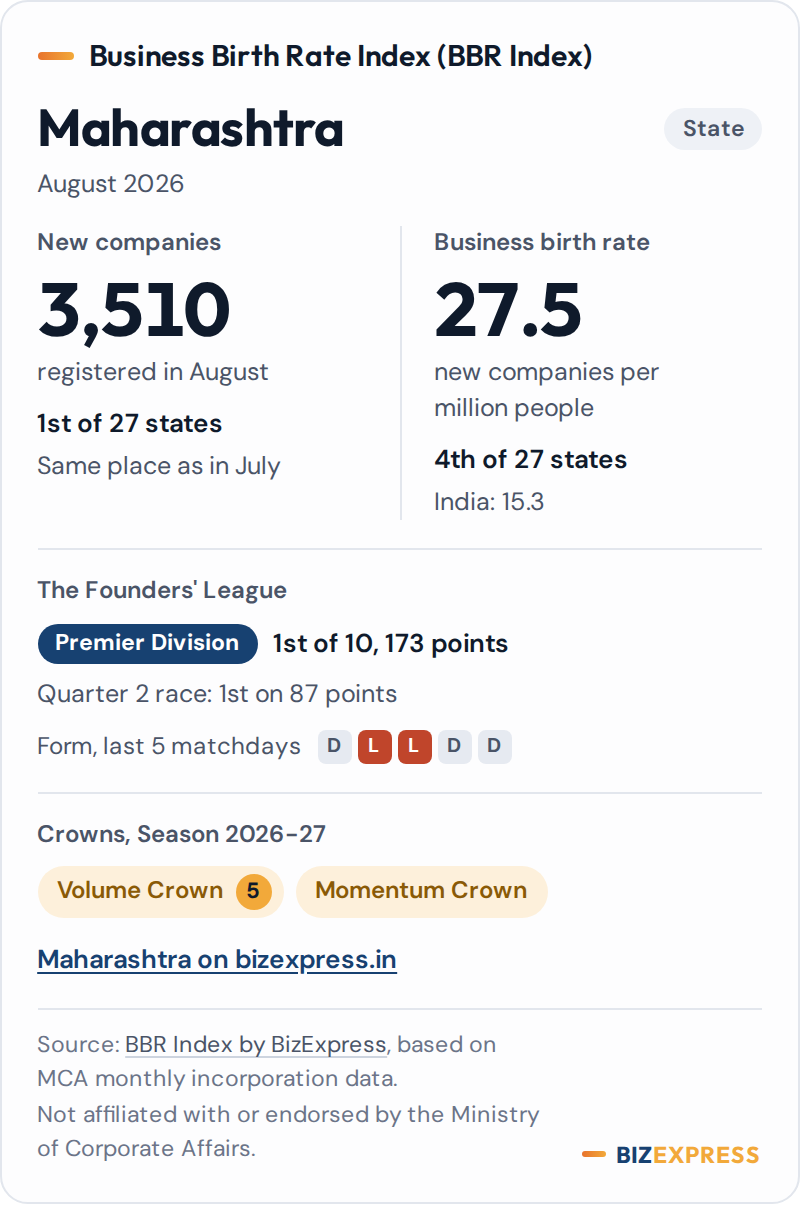
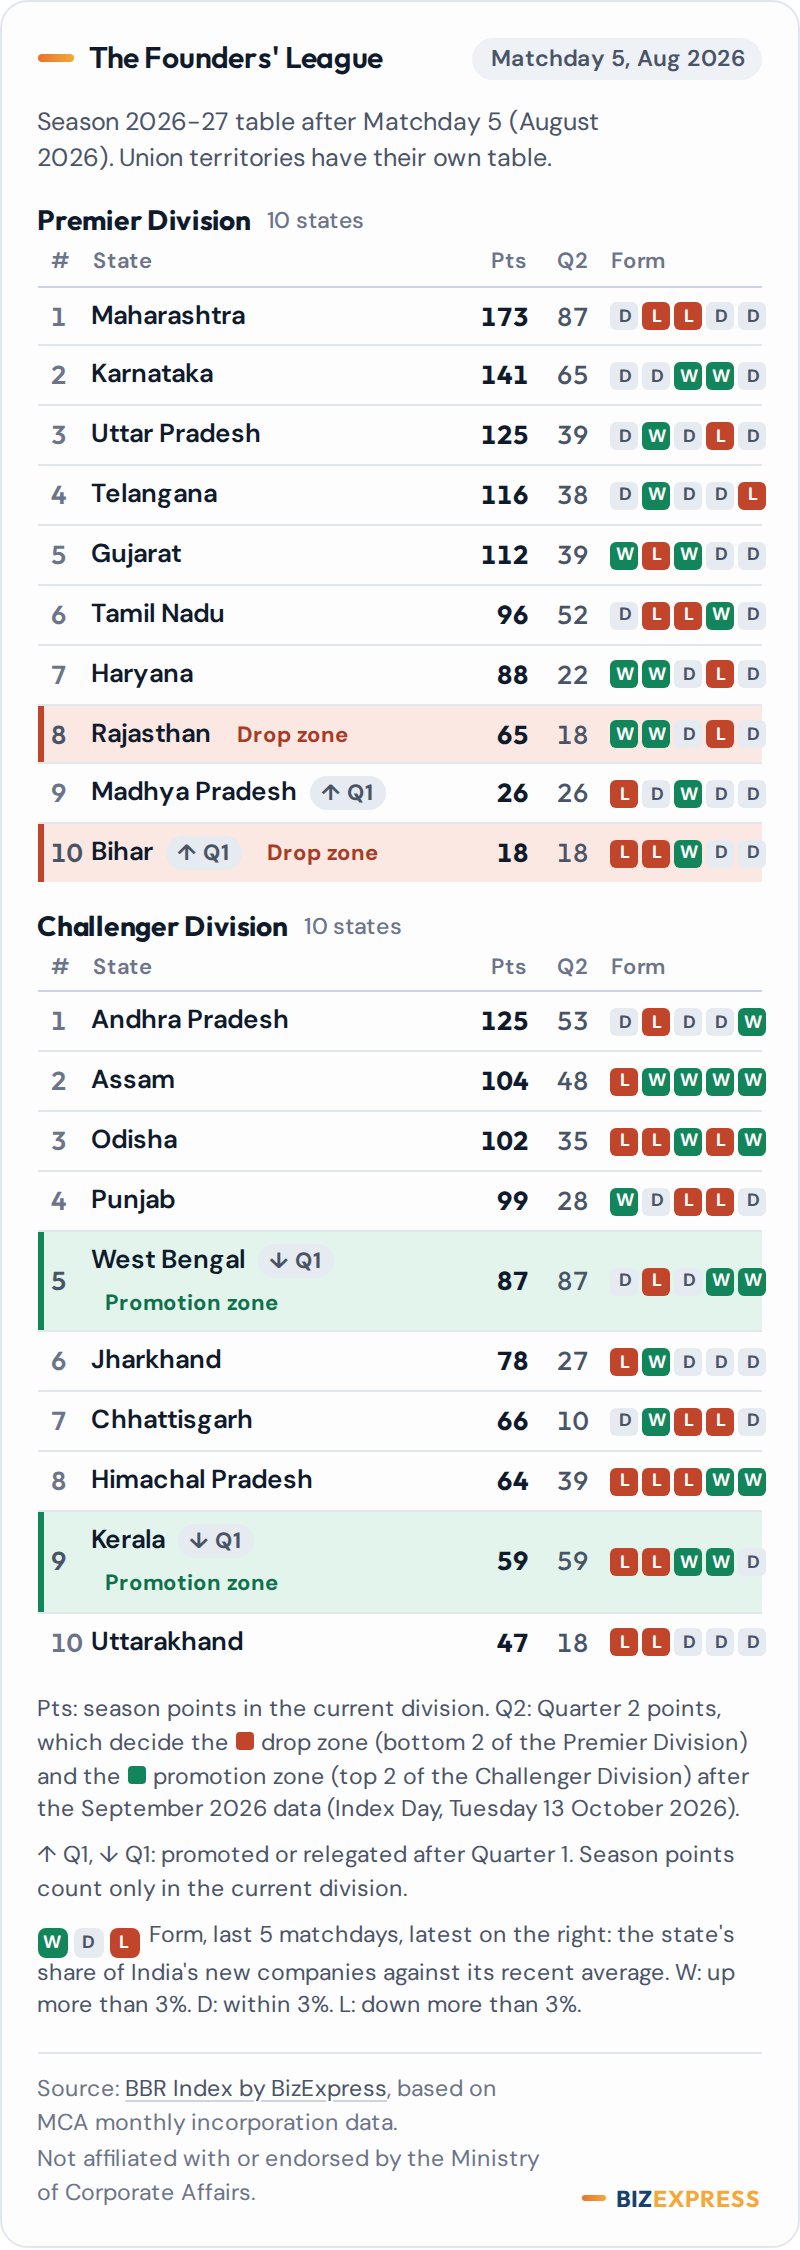
Free to embed on any site with attribution: keep the widget's source line visible and do not edit, crop or overlay the figures. The Company Clock is an estimate at the recent daily pace, not a live count. Frames are 400 pixels wide and narrow with your column; the heights fit widths from 320 to 600 pixels.
Methodology in brief
How the BBR Index and the business birth rate are built. The full methodology sets out every definition, adjustment and revision rule.
Source
The monthly incorporation files of the Ministry of Corporate Affairs (MCA): every company and limited liability partnership registered in India, dated by its date of incorporation. This release covers January to September 2026, with data through 30 September 2026: 2,04,754 companies and 89,199 LLPs.
The index
Companies registered in the month are divided by its working days, then by the base of 994.1 companies per working day (the January to August 2026 average), and multiplied by 100. September 2026: 24,325 companies over 24.0 working days is 1,013.5 a day, an index of 102.0.
Business birth rate
New companies in a month per million people, using the 2024 projected population. States are ranked among states and union territories among union territories; places with fewer than 1 million people are listed but not ranked.
States, not ROC offices
The MCA file has no address field, so each company is placed by the ROC code in its CIN, which maps to exactly one state or union territory. ROC offices appear only as detail inside a state and are never ranked.
Revisions
The whole series is recalculated every month from the MCA files, so earlier values can change if the MCA revises a file. Cite the reading month and use the latest figures.
Questions about the BBR Index
What is the Business Birth Rate Index (BBR Index)?
The Business Birth Rate Index (BBR Index) is a monthly measure, published by BizExpress, of how fast new companies are being formed in India. It counts companies registered per working day and sets the January to August 2026 average at 100, so a reading above 100 means a busier month than that average. The September 2026 reading was 102.0. Sub-indices and business birth rates for every state and union territory come with it.
How is the BBR Index calculated?
Companies registered in the month are divided by the month's working days, where Monday to Friday count as one day, Saturday as half, and Sundays and days with no registrations as zero. The result is divided by the base of 994.1 companies per working day, the January to August 2026 average, and multiplied by 100. In September 2026, 24,325 companies over 24.0 working days gave 1,013.5 a day and an index of 102.0.
Is the BBR Index an official government statistic?
No. The BBR Index is an independent analysis by BizExpress of public incorporation data published by the Ministry of Corporate Affairs (MCA). It is not affiliated with or endorsed by the Ministry of Corporate Affairs. The underlying counts come from the MCA's monthly files; the working-day adjustment, the index, the sub-indices and the rankings are BizExpress's own calculations, set out in full in the methodology.
Where does the data come from?
From the monthly incorporation files that the Ministry of Corporate Affairs publishes. They list every company and limited liability partnership incorporated in India, and every foreign company that registers a place of business here, with its registration number, name, date and business activity. The files have no address field, so each company is placed in a state or union territory by the Registrar of Companies (ROC) code in its Corporate Identification Number (CIN).
What is the business birth rate?
The business birth rate is the number of new companies registered in a month for every million people, using 2024 projected population. It adjusts for population, so a small state can be compared fairly with a large one. In September 2026 India's rate was 17.3; Telangana led the states at 45.2 and Delhi led the union territories at 91.9. Places with fewer than 1 million people are shown but not ranked.
Why are union territories ranked separately from states?
Several union territories are largely urban. Delhi and Chandigarh are city territories, so their companies per million people are not comparable with whole states that include large rural areas. To keep every comparison fair, states are ranked only among states and union territories only among union territories. The Founders' League is played by states, and union territories have their own table.
How often is the BBR Index updated, and when is the next Index Day?
Monthly. Each release comes out on Index Day, the 5th of the month, and covers the previous month's MCA data. The next Index Day is Thursday 5 November 2026, with October 2026 data. The whole series is recalculated with each release, so earlier values can change slightly if the MCA revises a file; cite the reading month with any figure.
Can I republish the BBR Index charts and data?
Yes. The charts, data files and widgets on this page are free to republish with credit to the BBR Index by BizExpress. With a chart or a short quote, use the line: Source: BBR Index by BizExpress, based on MCA monthly incorporation data. Please do not alter the numbers, and describe the index as an independent analysis, not an official statistic. Press enquiries: pr@bizexpress.in.
From the Incorporation Experts
Registering a company or LLP?
A company is incorporated through SPICe+ (Simplified Proforma for Incorporating Company Electronically Plus), the MCA web form INC-32 that combines name reservation and incorporation, and its certificate of incorporation carries its CIN. The first deadlines follow quickly: a company with share capital must file its declaration for commencement of business in Form INC-20A within 180 days of incorporation, and its Board must appoint the first auditor within 30 days of registration.
An LLP is incorporated through Form FiLLiP and must file its LLP agreement in Form 3 within 30 days of incorporation.
BizExpress takes private limited companies and LLPs from name approval to certificate, and keeps the filings that follow on time.